Posts

Showing posts with the label Visualization

2025-01-06: Data Visualization Class Projects - Fall 2024

Image
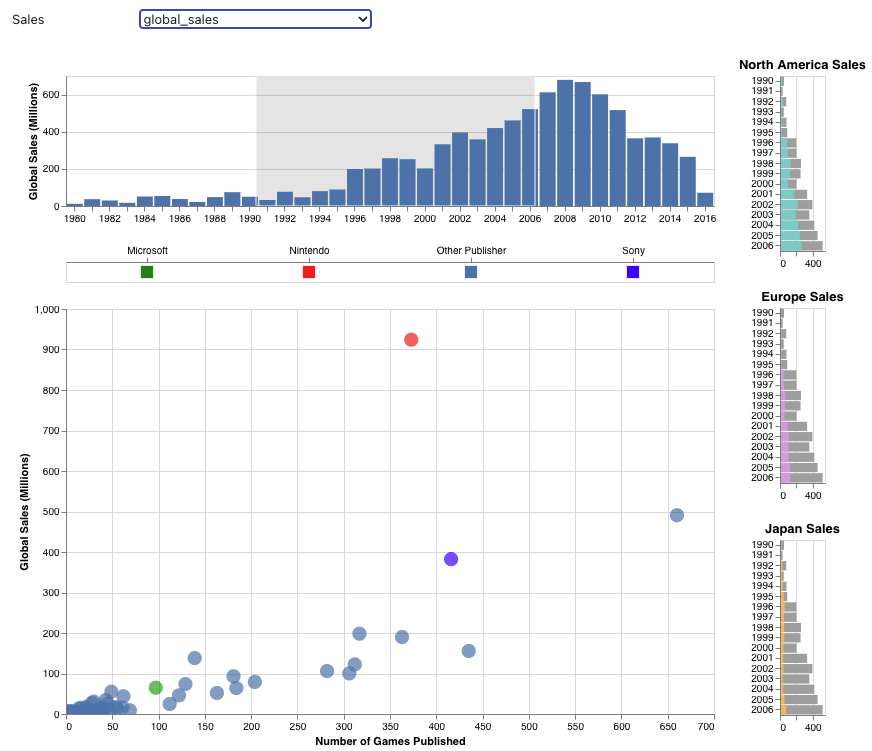
It's been a couple years since I last posted on my visualization students' projects, but I wanted to continue the tradition with highlights from my most recent class. (Previous semester's posts are available via the VisProjects label on the blog.) Fall 2024 was the first time that I taught CS 625 Data Visualization  in a fully asynchronous mode. During summer and fall, I recorded supplemental videos to go along with Dr. Tamara Munzner's Visualization Analysis and Design   textbook and YouTube lectures . Most of the students in the class were working full-time while taking courses towards their Masters in Computer Science or Data Science at ODU. It was great experience, and I plan to continue teaching this course asynchronously every year (we have other faculty teaching the course in person). The final project asks students to create static explanatory visualization (i.e., a single chart or group of charts presented as a faceted chart) that reveals something interestin...
2022-12-02: Visualization Class Projects - 2021-2022

Image
I've gotten a bit behind with posting highlights from my visualization course projects, so this is a catch-up post. Since 2019, I've been teaching two visualization courses, CS 625 Data Visualization and CS 725/825 Information Visualization and Data Analytics. In this post, I'll cover CS 725/825 from Spring 2021 , CS 625 from Fall 2021 , and CS 725/825 from Spring 2022 . (Previous semester's posts are available via the VisProjects label on the blog.) CS 725/825 - Spring 2021 In 2019, I was asked to develop a 600-level data visualization course to be part of the core requirements for ODU's MS in Data Science and Analytics program . Since this new course could cover the basics of data visualization theory, I was able to adapt my existing CS 725/825 Information Visualization course to include more advanced topics, which also allowed it to serve as an elective in the Artificial Intelligence and Machine Learning concentration of the new MS program. With these changes,...

2022-07-01 - Using GDELT to Monitor Xenophobic Violence Towards Migrants and Refugees project funded by ODU Data Science Seed Funding Program

Image
We are grateful to have received one of four Data Science Seed Funding awards from ODU to begin an investigation into using worldwide news data from  GDELT  to monitor xenophobic violence towards migrants and refugees. This is joint work with Erika Frydenlund from VMASC and will support one PhD student for one year.  The goal of the Data Science Seed Funding program was to foster collaborations between on-campus ODU faculty and VMASC researchers in the area of data science. Michele C. Weigle and Erika Frydenlund, Data Science for Social Good: Mining and Visualizing Worldwide News to Monitor Xenophobic Violence Towards Migrants and Refugees, ODU Data Science Seed Funding, Jul 2022 - Jun 2023, $38,000. Monitoring the prevalence of xenophobic violence towards migrants and refugees is an important requirement for policymakers to provide support and resources to the areas most in need. Previous approaches have largely involved manual curation of news articles and data ...

2022-06-27: Computation + Journalism 2022 Trip Report

Image
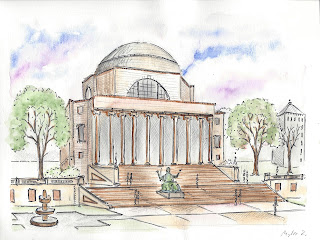
The 2022 Computation + Journalism (C+J) Symposium was held in-person at Columbia University and online, June 9-11 . The proceedings are now available with links to PDFs of the referred submissions. I virtually attended several of the sessions on Thursday and Friday, but unfortunately missed the Saturday sessions. A full hybrid session in motion… #cj2022 pic.twitter.com/WhPE7kL6x9 — Bahareh Heravi (@Bahareh360) June 10, 2022 After the success of the fully online C+J 2021, the organizers again used the ohyay.co platform for the online attendees and speakers. In general it worked great again. My only complaint is that the speakers' slides were sometimes too small because of the space given to speaker and panel video and other decorative elements (or maybe it was just too small to view on my laptop screen). Most of the sessions were parallel, so like last year , I had a little trouble deciding which sessions to attend; they all contained interesting work. I didn't ta...

2021-04-05: Data Visualization Fall 2020 Projects

Image
(Previous semester Information Visualization highlights posts: Fall 2019 , Fall 2017 , Spring 2017 , Spring 2016 , Spring 2015 , Spring/Fall 2013 , Fall 2012 , Fall 2011 ) Fall 2020 was the second offering of CS 625: Data Visualization , a graduate-level visualization course that is part of the CS Masters program and is a core course in the Data Science and Analytics MS program . I had originally designed this as a flipped+hybrid course (described in an earlier blog post ), so teaching this during COVID-times was not too much different than normal.  We use Tamara Munzner's Visualization Analysis and Design textbook and focus on basic visualization design principles and on how to ask good questions. Students were allowed to use whatever tool they wished, but I emphasized clear design no matter what tool was used. Over the course of two assignments ( HW7 , HW8 ), students developed questions about real-world data, developed a draft visualization, and then refined the visualiza...

2021-02-25: Computation + Journalism 2021 Trip Report

Image
One year ago, I was eagerly anticipating a trip to Boston in mid-March to attend the Computation + Journalism (C+J) Symposium 2020 hosted by Northeastern University.  Our PhD student Alexander Nwala would be presenting a poster on his Storygraph work, and I was especially looking forward to the keynote addresses, in particular one from Amanda Cox, whose work I've highlighted in my Information Visualization courses for several years. Unfortunately, this was the first of several conferences for me to be impacted by the coronavirus pandemic.  So, I was thrilled that the organizers decided to revive the 2020 program as a virtual symposium this year ( program and schedule ). Videos are promised, and I'll update this post when that's available.  [5/7/21: Recordings of the keynote speakers and panels are now available!] Some statistics from Computation+Journalism 2021 - A total of 879 people attended at least some part of the day, with a maximum of 415 people at any one tim...