Posts

Showing posts with the label VisProjects

2025-01-06: Data Visualization Class Projects - Fall 2024

Image
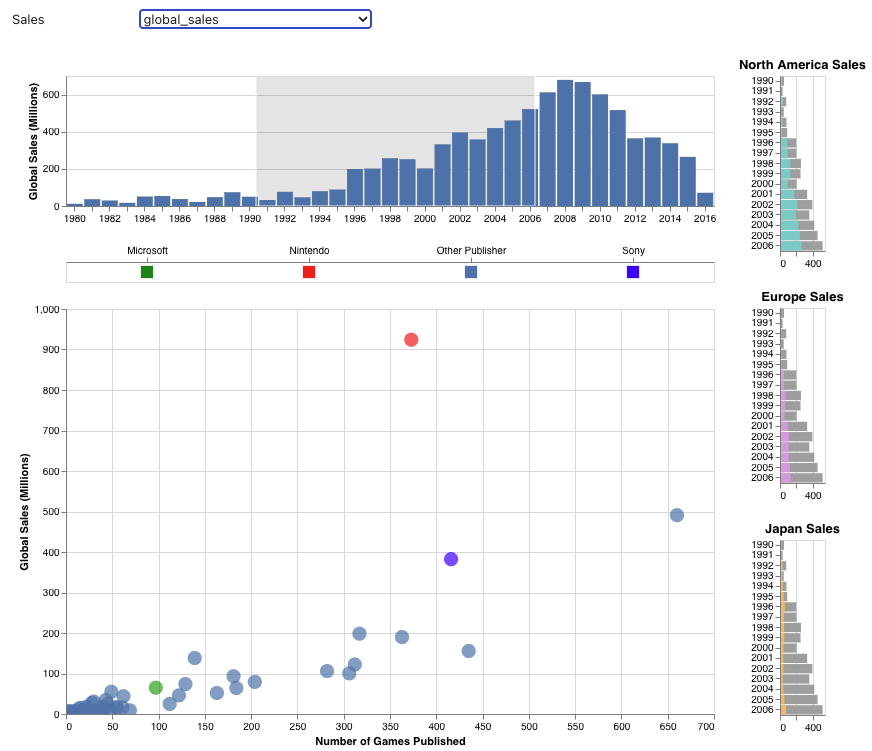
It's been a couple years since I last posted on my visualization students' projects, but I wanted to continue the tradition with highlights from my most recent class. (Previous semester's posts are available via the VisProjects label on the blog.) Fall 2024 was the first time that I taught CS 625 Data Visualization  in a fully asynchronous mode. During summer and fall, I recorded supplemental videos to go along with Dr. Tamara Munzner's Visualization Analysis and Design   textbook and YouTube lectures . Most of the students in the class were working full-time while taking courses towards their Masters in Computer Science or Data Science at ODU. It was great experience, and I plan to continue teaching this course asynchronously every year (we have other faculty teaching the course in person). The final project asks students to create static explanatory visualization (i.e., a single chart or group of charts presented as a faceted chart) that reveals something interestin...
2022-12-02: Visualization Class Projects - 2021-2022

Image
I've gotten a bit behind with posting highlights from my visualization course projects, so this is a catch-up post. Since 2019, I've been teaching two visualization courses, CS 625 Data Visualization and CS 725/825 Information Visualization and Data Analytics. In this post, I'll cover CS 725/825 from Spring 2021 , CS 625 from Fall 2021 , and CS 725/825 from Spring 2022 . (Previous semester's posts are available via the VisProjects label on the blog.) CS 725/825 - Spring 2021 In 2019, I was asked to develop a 600-level data visualization course to be part of the core requirements for ODU's MS in Data Science and Analytics program . Since this new course could cover the basics of data visualization theory, I was able to adapt my existing CS 725/825 Information Visualization course to include more advanced topics, which also allowed it to serve as an elective in the Artificial Intelligence and Machine Learning concentration of the new MS program. With these changes,...

2021-04-05: Data Visualization Fall 2020 Projects

Image
(Previous semester Information Visualization highlights posts: Fall 2019 , Fall 2017 , Spring 2017 , Spring 2016 , Spring 2015 , Spring/Fall 2013 , Fall 2012 , Fall 2011 ) Fall 2020 was the second offering of CS 625: Data Visualization , a graduate-level visualization course that is part of the CS Masters program and is a core course in the Data Science and Analytics MS program . I had originally designed this as a flipped+hybrid course (described in an earlier blog post ), so teaching this during COVID-times was not too much different than normal.  We use Tamara Munzner's Visualization Analysis and Design textbook and focus on basic visualization design principles and on how to ask good questions. Students were allowed to use whatever tool they wished, but I emphasized clear design no matter what tool was used. Over the course of two assignments ( HW7 , HW8 ), students developed questions about real-world data, developed a draft visualization, and then refined the visualiza...

2020-06-19: Data Visualization Fall 2019 Projects

Image
(Previous semester Information Visualization highlights posts: Fall 2017 , Spring 2017 , Spring 2016 , Spring 2015 , Spring/Fall 2013 , Fall 2012 , Fall 2011 ) In Fall 2019, I introduced CS 625: Data Visualization , a new graduate-level visualization course. (This course was taught in a flipped+hybrid manner, as I described in an earlier blog post .) We used the same textbook, Tamara Munzner's Visualization Analysis and Design , as in my previous CS 725/825 Information Visualization courses, but this course was designed to be a gentler introduction to visualization and data analysis. We focused on basic visualization design principles and on how to ask good questions rather than D3 programming. Students were allowed to use whatever tool they wished, but I emphasized clear design no matter what tool was used. Over the course of two assignments ( HW7 , HW8 ), students developed questions about real-world data, developed a draft visualization, and then refined the visualization based ...

2018-07-11: InfoVis Fall 2017 Class Projects

Image
(Previous semester highlights posts: Spring 2017 , Spring 2016 , Spring 2015 , Spring/Fall 2013 , Fall 2012 , Fall 2011 ) Here are a few projects that I'd like to highlight from Fall 2017. (All class projects are listed in my InfoVis Gallery .)  All of the projects were implemented using the D3.js library. World Leader Interactions on Social Media (Twitter)  Created by Grant Atkins This project (available at http://www.cs.odu.edu/~gatkins/world-leader-vis/app/ ) provides an interactive dashboard to visualize ways Twitter list data can be used and represented. This visualization uses the World Leaders list on Twitter , with the addition of a few world leaders not on the list, to derive information and visualize shared information among these users. The goal of this visualization is to show shared term usage among world leaders, see which times tweets are more likely to be sent out, the sentiment of the users, and the decay of data allocated in a static decreasin...

2018-06-27: InfoVis Spring 2017 Class Projects

Image
This may sound familiar , but yet again I'm way behind in posting about my previous offerings of CS 725/825 Information Visualization. (Previous semester highlights posts: Spring 2016 , Spring 2015 , Spring/Fall 2013 , Fall 2012 , Fall 2011 ) Here are a few projects that I'd like to highlight from Spring 2017. (All class projects are listed in my InfoVis Gallery .  This semester has its own page because there were 19(!) projects.)  All of the projects were implemented using the D3.js library. Because the Spring 2017 semester began with President Donald Trump's Travel Ban ( EO 13769 ) and we have a large international graduate student population, students were understandably interested in US immigration and refugee data.  The first two projects here focus on that.  In addition, one project looked at sentiment about the US Presidential candidates on social media on Election Day. The last two projects that I'll highlight are focused on the lighter topic of ...

2017-06-09: InfoVis Spring 2016 Class Projects

Image
I'm way behind in posting about my Spring 2016 offering of CS 725/825 Information Visualization , but better late than never. (Previous semester highlights posts: Spring 2015 , Spring/Fall 2013 , Fall 2012 , Fall 2011 )   Here are a few projects that I'd like to highlight. (All class projects are listed in my InfoVis Gallery .) Expanding the WorldVis Simulation Created by Juliette Pardue, Mridul Sen, Christos Tsolakis This project (available at http://ws-dl.cs.odu.edu/vis/world-vis/ ) was an extension of the FluNet visualization , developed as a class project in 2013. The students extended the specialized tool to account for general datasets of quantitative attributes per country over time and added attributes based on continent average. They also computed summary data for each dataset for each year, so at a glance, the user can see statistical information including the country with the minimum and maximum value. This work was accepted as a poster to IEEE VIS 2...

2015-09-21: InfoVis Spring 2015 Class Projects

Image
In Spring 2015, I taught Information Visualization (CS 725/825) for MS and PhD students.  This time we used Tamara Munzner 's Visualization Analysis & Design textbook, which I highly recommend : "This highly readable and well-organized book not only covers the fundamentals of visualization design, but also provides a solid framework for analyzing visualizations and visualization problems with concrete examples from the academic community. I am looking forward to teaching from this book and sharing it with my research group." —Michele C. Weigle, Old Dominion University I also tried a flipped-classroom model , where students read and answer homework questions before class so that class time can focus on discussion, student presentations, and in-class exercises. It worked really well -- students liked the format, and I didn't have to convert a well-written textbook into Powerpoint slides. Here I highlight a couple of student projects from that course.  (All c...

2014-10-07: FluNet Visualization

Image
(Note: This wraps up the current series of posts about visualizations created either by students in our research group or in our classes. I'll post more after the Spring 2015 offering of the course.) I've been teaching the graduate Information Visualization course since Fall 2011.  In this series of posts, I'm highlighting a few of the projects from each course offering.  (Previous posts: Fall 2011 , Fall 2012 , 2013 ) The final visualization in this series is an interactive visualization of the World Health Organization's global influenza data, created by Ayush Khandelwal and Reid Rankin in the Fall 2013 InfoVis course. The visualization is currently available at https://ws-dl.cs.odu.edu/vis/flunet-vis/ and is best viewed in Chrome. The  Global Influenza Surveillance and Response System (GISRS) has been in operation since 1995 and aggregates data weekly from laboratories and flu centers around the world. The FluNet website was constructed to provide access t...

2014-08-28: InfoVis 2013 Class Projects

Image
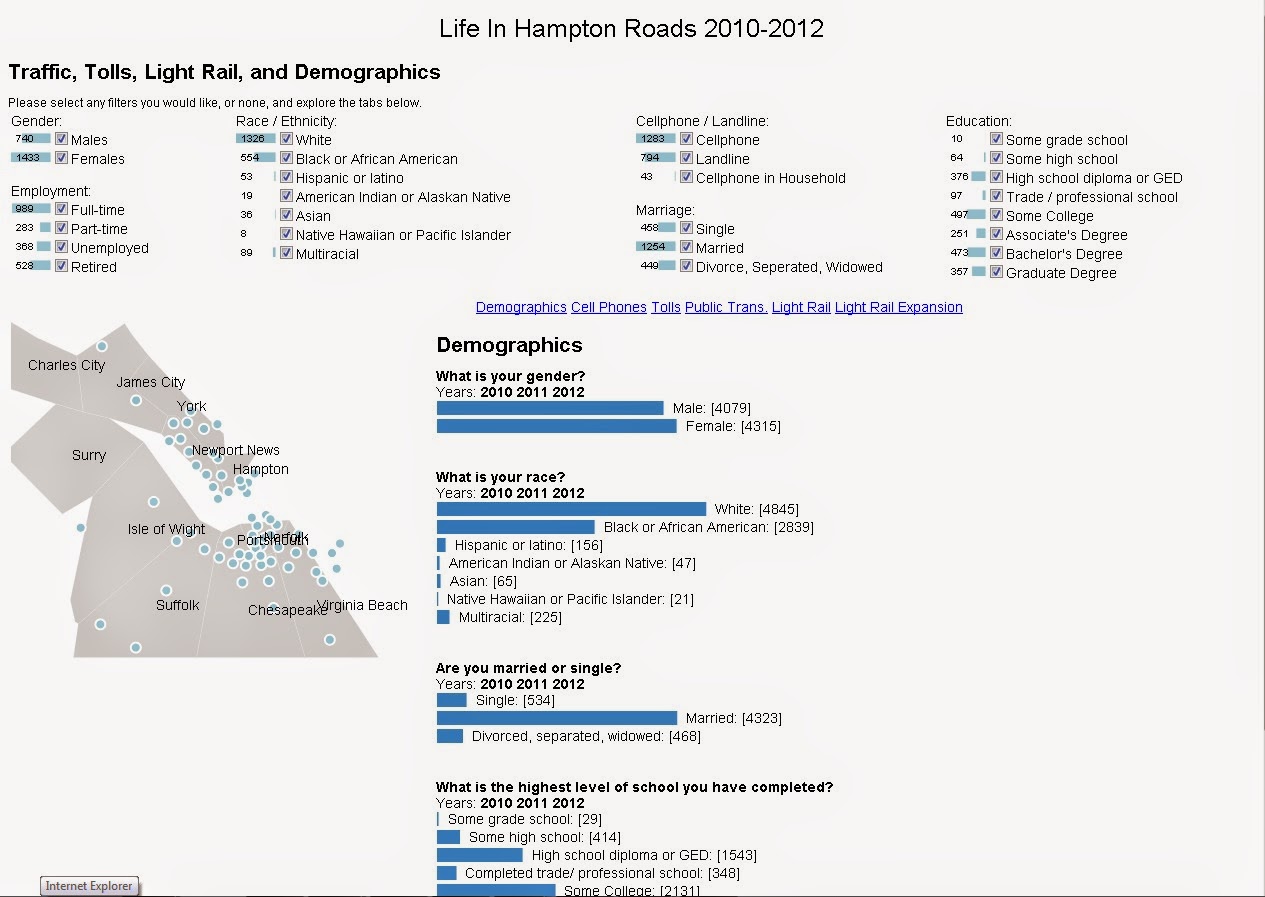
(Note: This is continuing a series of posts about visualizations created either by students in our research group or in our classes.) I've been teaching the graduate Information Visualization course since Fall 2011.   In this series of posts, I'm highlighting a few of the projects from each course offering.  (Previous posts: Fall 2011 , Fall 2012 ) In Spring 2013, I taught an Applied Visual Analytics course that asked students to create visualizations based on the "Life in Hampton Roads" annual survey performed by the Social Science Research Center at ODU.  In Fall 2013, I taught the traditional InfoVis course that allowed students to choose their own topics.  (All class projects are listed in my InfoVis Gallery .) Life in Hampton Roads Created by Ben Pitts, Adarsh Sriram Sathyanarayana, Rahul Ganta This project (currently available at https://ws-dl.cs.odu.edu/vis/LIHR/ ) provides a visualization of the "Life in Hampton Roads" survey for 20...

2014-07-07: InfoVis Fall 2012 Class Projects

Image
(Note: This is continuing a series of posts about visualizations created either by students in our research group or in our classes.) I've been teaching the graduate Information Visualization course since Fall 2011.   In this series of posts, I'm highlighting a few of the projects from each course offering.  (Previous post: Fall 2011 ) The Fall 2012 projects were based on the 2012 ODU Infographics Contest . Participants were tasked with visualizing the history and trajectory of work done in the area of quantum sensing. (All class projects are listed in my InfoVis Gallery .) Top Quantum Sensing Trends Created by Wayne Stilwell This project (currently available at https://ws-dl.cs.odu.edu/vis/quantum-stilwell/ ) is a visualization for displaying the history and trajectory of quantum sensing. History is shown as a year-by-year slideshow. The most publicized quantum sensing areas for the selected year are displayed. Clicking on a topic shows the number of publicatio...

2014-06-26: InfoVis Fall 2011 Class Projects

Image
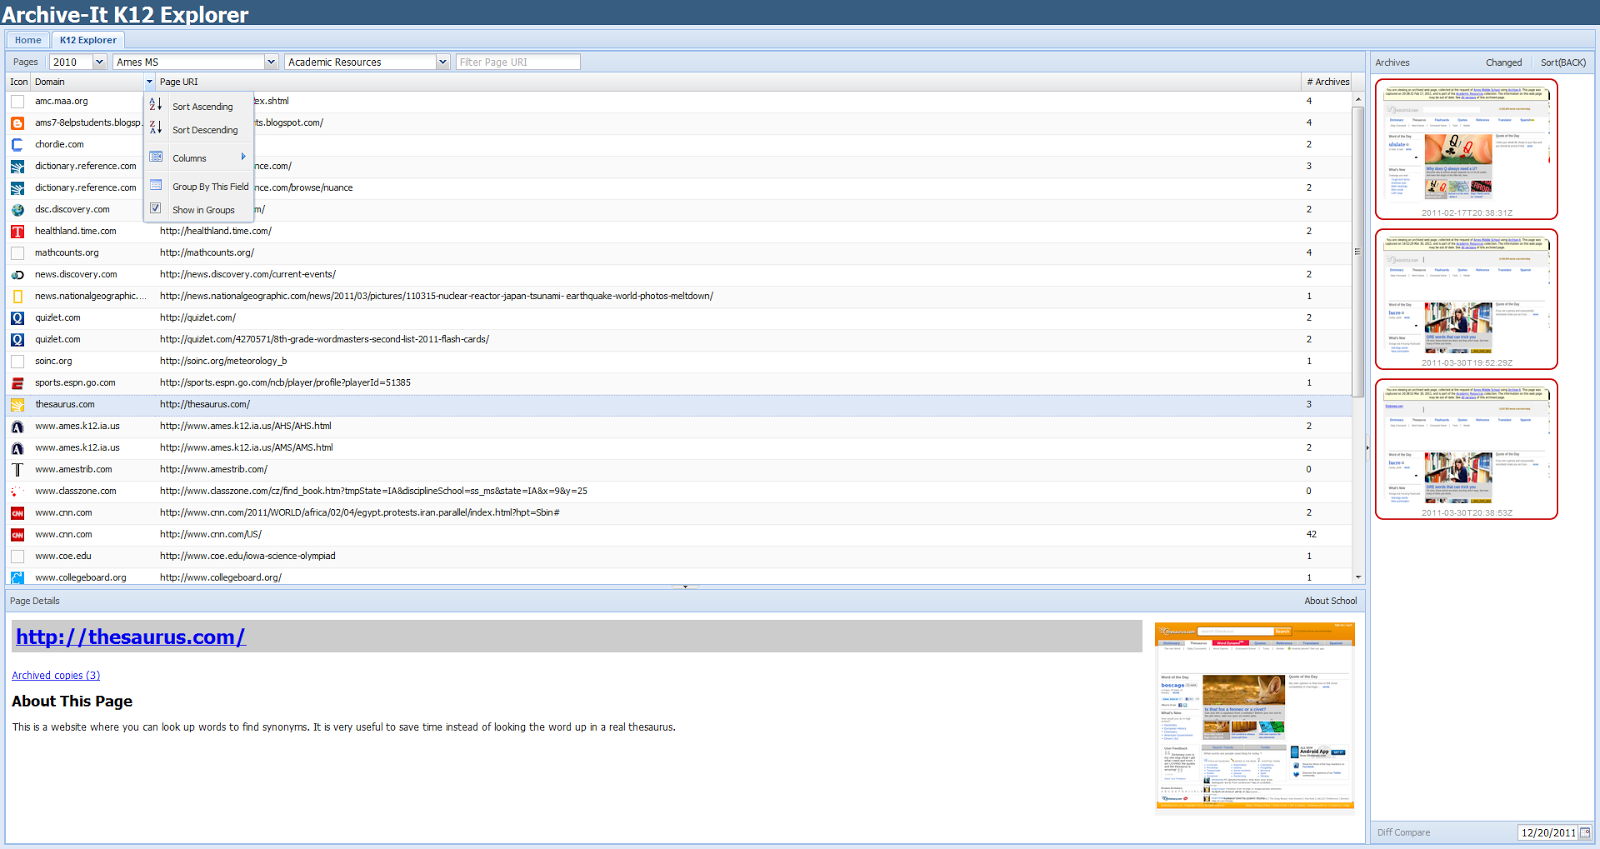
(Note: This is continuing a series of posts about visualizations created either by students in our research group or in our classes.) I've been teaching the graduate Information Visualization course (then CS 795/895, now CS 725/825) since Fall 2011. Each semester, I assign an open-ended final project that asks students to create an interactive visualization of something they find interesting.  Here's an example of the project assignment . In this series of blog posts, I want to highlight a few of the projects from each course offering.  Some of these projects are still active and available for use, while others became inactive after their creators graduated. The following projects are from the Fall 2011 semester.  Both Sawood and Corren are PhD students in our group.  Another nice project from this semester was done by our PhD student Yasmin AlNoamany and MS alum Kalpesh Padia.  The project led directly to Kalpesh's MS Thesis, which has its own blog post ....