2022-06-17: StreamingHub - Building Reusable, Reproducible Workflows
As researchers, we often create artifacts (i.e., data and code) that others (including ourselves) might reuse in the future. Especially during early stages of research (i.e., the exploration phase), we hack bits and pieces of code together to test out different hypotheses. Upon discovering few hypotheses that work, our focus shifts towards rigorous testing, academic writing, and publication.
At which stage should we ensure the reusability of those artifacts? Ideally, as early as possible; yet this is easier said than done. For instance, at exploration stage, it's often impractical to allocate time for data/code reusability. After all, at this point, it's quite unclear whether the hypotheses would even pan out. Likewise, at every stage that follows, it's quite easy to get consumed with testing, academic writing, and publication. Such circumstances have, and continue to, push reusability down to an afterthought.
On the flip side, having to work with "difficult" artifacts (e.g., datasets with incomplete descriptions, code with no steps to reproduce) significantly slows down any follow-up work. For instance, if a researcher attempts to reuse an artifact, but later discovers that it lacks some key information, they may waste hours trying to piece things together.
What can we do about it?
We can improve the reusability and reproducibility of artifacts in several ways. For code artifacts, this may include documenting the exact steps to reproduce, and having comments to clarify hard-to-understand areas. Moreover, having the research process well-documented, and implementing workflows in a modular fashion, improves reproducibility. In fact, improving these aspects have been a broad subject of research. Research contributions in this field can be categorized into three aspects - Metadata Standards, Workflow Management Systems, and Visual Programming Interfaces.
Metadata Standards
By definition, Metadata is "data that provide information about other data". Its purpose is to summarize basic information about data, which, in turn, simplifies how we work with data. Imagine being given a bunch of data without any knowledge of what they are. Here, you may spend some time inspecting the data, just to get an idea of it. Even if you do get an idea, your understanding may be incomplete, or worse, different from what the data actually means. This is where metadata serves its purpose; having metadata lets others know exactly what the creator wants them to know, and lets them build upon that.
Depending on the problem being investigated, researchers may collect fresh data (e.g., user studies, application logs, sensory readings), reuse already collected data (e.g., publicly available datasets), or do both. In either case, the data being collected/reused should contain metadata to convey what the data means, and preferably, how they were collected. In such scenarios, having quality metadata helps to ensure reusability and reproducibility.
Workflow Management Systems
Documenting the research process is critical to create reproducible research assets. However, research processes could be fairly complex, and thereby painstaking to document in detail. In cases as such, verifying the integrity of results could be even difficult. This is where 'scientific workflows' help; a scientific workflow, by definition, is "the description of a process for accomplishing a scientific objective, usually expressed in terms of tasks and their dependencies". Scientific Workflow Management Systems (e.g., Kepler, Pegasus) let users design workflows either visually, e.g., using data flow diagrams, or programmatically, using a domain-specific language. This makes it easy to share workflows that are runnable, thereby enabling others to verify both the research process and the results obtained.
Visual Programming Interfaces
Visual programming is "a type of programming language that lets humans describe processes using illustration". It allows scientists to develop applications based on visual flowcharting and logic diagramming. Visual programming is beneficial for several reasons; primarily, applications built using visual programming are more accessible to novices. Moreover, having a visual representation makes it easy to understand applications at a conceptual level, analogous to how data is described via metadata.
Software such as Node-RED, Orange, NeuroPype, and Orchest provides visual-programming interfaces to design data-driven workflows. Orange is geared towards exploratory data analysis and interactive data visualization, while NeuroPype is geared towards neuroimaging applications. Node-RED and Orchest, however, is more generic, and allows to build data-driven applications with ease.
StreamingHub
First, I'll introduce StreamingHub. Second, I'll explain how we used it to build real-time analytics workflows for different domains, and the lessons we learnt by doing so.
For time-critical tasks like stock prediction, fraud detection, and weather prediction, we often develop algorithms that run continously on a stream of input measurements, and generate a continuous stream of outputs. For such algorithms, latency is a practical constraint; to exemplify, if a weather prediction algorithm only predicts 5-minutes ahead, it wouldn't have much practical value.
StreamingHub is a data access framework for real-time data processing. It consists of four components.
- Data Flow Description Schema (DFDS)
- Curator (New! 2024)
- DataMux
- Workflow Engine

Data Flow Description Schema (DFDS)
DFDS is a collection of metadata schemas for describing streams, datasets, and devices. In DFDS, datasets are described using the DFDS Collection schema, whereas live sensors are described using DFDS Node schema. The two schemas serve as a blueprint of the streams generated by datasets and device nodes. For the curious, some examples are given below:
Example 1 - Device Metadata
Example 2 - Collection Metadata
Curator (Update: 2024)
Curator is a Web App to organize bio-signal recording files in a canonical way, convert the files into open file formats (e.g., CSV, Parquet), and package them into a shareable dataset that can be replayed on StreamingHub. We developed Curator using Python, Flask, and React. In its UI, we allow users to (a) pick files, (b) extract metadata from file names/paths, (c) define which streams should be generated from the files, (d) define which columns/keys map to each stream, and (e) download this data as a shareable package. Internally, Curator transforms the data into a canonical file structure, saves the stream information as DFDS metadata, and lets users download them as a tar.gz file. Here our goal is to (a) map all dataset files onto a common structure, (b) index this structure using DFDS metadata, and (c) use the structural information to replay the dataset's content. Doing so poses no platform-locking risk, as we only utilize open formats (.csv, .parquet, .h5, .npy) to store data.


DataMux
The data mux operates as a bridge between connected sensors, datasets, and data streams. It uses DFDS metadata to create the data streams needed for a task, and streams both data and DFDS metadata.
The data mux provides three modes of execution:
- Replay - stream data from a dataset
- Simulate - generate and stream simulated data from a dataset
- Live - stream real-time data from connected sensors
In replay mode, the Data Mux reads and streams data (files) at their recorded (sampling) frequency. In simulate mode, it generates and streams synthetic data (guided by test cases) at their expected sampling frequency. In live mode, it connects to (live) sensory data sources and streams them. It utilizes DFDS dataset/analytic metadata in the replay and simulate modes, and DFDS datasource metadata in the live mode. When generating analytic outputs from data streams, the metadata from both the input source(s) and analytic process(es) are propagated into the output data to minimize the required manual labor for making analytics reusable, reproducible, and thus verifiable.
 |
| DataMux README (from GitHub) |
Workflow Engine
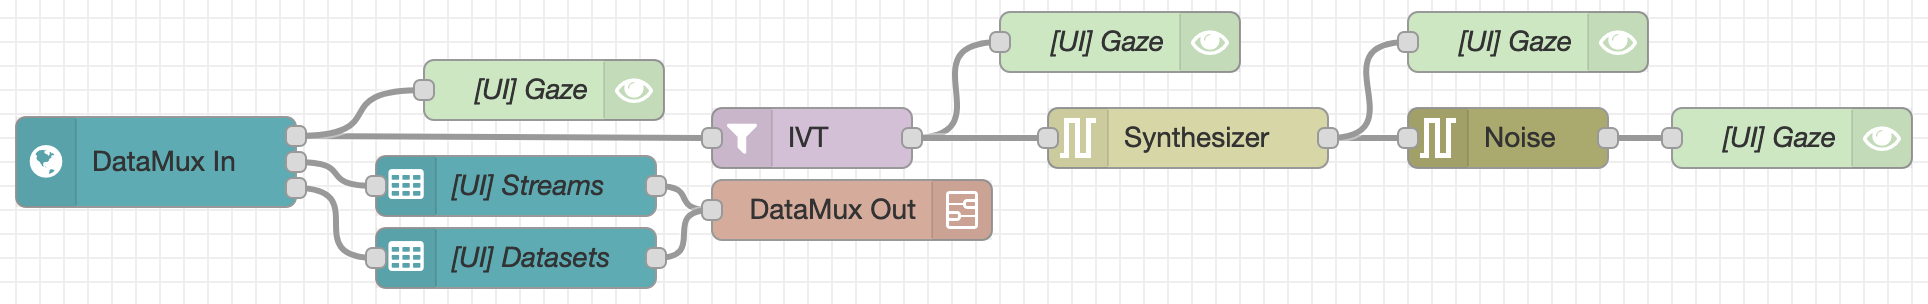 |
| Workflow Designed Using Node-RED |
Depending on need, users may create sub-flows that implement custom logic. These sub-flows can later be reused within complex flows, or even shared with others. The image above shows an eye movement analysis workflow we designed using Node-RED. Here, the nodes defined as Stream Selector, IVT Filter, and Synthesizer are eye-movement specific sub-flows that we implemented ourselves.
 |
| Dashboard Designed Using Node-RED, running on DataMux Streams |
The operations dashboard is also generated using Node-RED. It allows users to perform interactive visualizations and data-stream control actions. Here, users have the option to visualize the data generated at any point in the analytics workflow. All visualizations are dynamic, and updated in real-time as new data is received. Moreover, the available visualization options are determined by data type. The image above shows the operations dashboard that we created for an eye movement analysis task.
The video linked below shows a quick end-to-end demo of StreamingHub in action. Here, I show how a dataset can be replayed using the StreamingHub Data Mux, and subsequently processed/visualized via a domain-specific workflow in Node-RED.
In the future, we plan to include five data-stream control actions in the operations dashboard: start, stop, pause, resume, and seek. By doing this, we hope to enable users to inspect data streams temporally and perform visual analytics; a particularly useful feature when analyzing high-frequency, high-dimensional data. If you're interested in learning more, please refer to my paper titled "StreamingHub: Interactive Stream Analysis Workflows" at JCDL 2022 [Preprint]. Also check out my presentation on StreamingHub at the 2021 WS-DL Research Expo below.
Comments
Post a Comment