2021-02-13: Summary of "Latent Feature Vulnerability Ranking of CVSS Vectors", Part II
When an academic researcher must condense months or even years of work into a few pages for peer-reviewed publication, some degree of selectivity is required in terms of what to include. A paper summary, like the one I presented in my blog post Summary of "Latent Feature Vulnerability Ranking of CVSS Vectors" can even further condense the original content and perhaps lead to additional questions. Sciuridae Hero (@attritionorg), also known as Brian Martin (industry expert on security topics), took note of my paper summary and offered a thoughtful critique via Twitter and his own detailed blog entries. In this posting, I would like to take a deeper look at each of Mr. Martin's bulleted comments and observations to 1) make sure I adequately represented the authors' original intent, 2) add clarity based on my understanding of the work, and 3) practice addressing thought-provoking questions such as these when the time comes to defend my own dissertation research. The following list is taken from Mr. Martin's posted comments.A critique of the summary of "Latent Feature Vulnerability Rankings of CVSS Vectors" (cc @correnmccoy https://t.co/Hmjph1CfNv
— Sciuridae Hero (@attritionorg) January 20, 2021
- The header graphic displays the metrics for the CVSSv3 scoring system, but is just labeled “CVSS”. Not only is this sloppy, it belies an important point of this summary that the paper’s work is based on CVSSv2 scores, not CVSSv3.
- Figure 1 did indeed present the CVSS v3 metrics which I have now properly noted in the caption. The differences between CVSS v2 and v3 are well documented. The Sciuridae Hero blog provided a link which explains those differences here.
 |
| Figure 1: CVSSv3 Score Metrics. (Source: Balbix) |
- The Ross et al. paper was published in 2017, so it is probable and likely the research on which it is based was conducted in the year prior or earlier. We note the final specification for CVSS v3.0 was released in June 2015 which would likely limit the amount of vulnerability data available for analysis prior to paper submission. To facilitate their work, Ross et al. used curated data made available by Allodi and Massacci which contained CVE IDs, CVSS v2 scores, and known "threats" in the form of exploit kits and Symantec inventories of malware and network attacks. I delved further into the Allodi et al. online appendix for their paper and discovered these additional details/disclaimers:
- Only CVE IDs disclosed in the years 2009, 2010, 2011, and 2012 were considered.
- Only CVE IDs affecting software also found in the Symantec Threat Database were considered.
- Ross et al. further pruned the included National Vulnerability Database (NVD) data to terminate with entries published prior to November 3, 2012 to better align with dates recorded on the exploit data.
- Knowing the limitations and constraints of the dataset should provide additional context for the results indicated by Ross et al. Namely, for research purposes, they assume "the NVD information provided by Allodi and Massacci enumerates the 'entire universe' of vulnerabilities and the exploit kits and Symantec data account for all known exploits (at the time of construction)." We should note academic researchers do not always have easy access to rich content such as the subscription-based VulnDB product that Mr. Martin mentions throughout his critique. However, using a known dataset, like the one made available by Allodi and Massacci, allows for comparative analysis.
- “Ross et al. note that many exploits exist without associated CVE-IDs. For example, only 9% of the Symantec data is associated with a CVE-ID. The authors offered additional caveats related to their probability calculation.” That sounds odd, but it is readily explained above when they summarize what that data is: “Symantec’s Threat Database (SYM): A database extracted from Symantec by Allodi and Massacci that contains references to over 1000 vulnerabilities.” First, that data set contains a lot more than vulnerabilities. Second, if Symantec is really sitting on over 900 vulnerabilities that don’t have a CVE ID, then as a CNA they should either assign them an ID or work with MITRE to get an ID assigned. Isn’t that the purpose of CVE?
- First, my interpretation is that Ross et al. were merely alluding to the fact that some Symantec attack signatures do not map directly to a CVE ID (Figure 2). This would be the context for "only 9% of the Symantec data is associated with a CVE-ID" in their dataset.
 |
| Figure 2: Excerpt from Symantec Security Center. (Source: https://www.broadcom.com/support/security-center/attacksignatures) |
- Second, I think that Ross et al. were more concerned with the correlation of known CVE IDs to attack signatures and exploit kits as way to evaluate their cluster-based vulnerability ranking algorithm. The mechanics of how Symantec reports CVEs to MITRE was a not a focal point of the research presented.
- “Ross et al. use four datasets reporting data on vulnerabilities and CVSS scores…” and then we see one dataset is “Exploit Database (Exploit-DB): A robust database containing a large collection of vulnerabilities and their corresponding public exploit(s).” Sorry, EDB doesn’t assign CVSS scores so the only ones that would be present are ones given by the people disclosing the vulnerabilities via EDB, some of whom are notoriously unreliable. While EDB is valuable in the disclosure landscape, serving as a dataset of CVSS scores is not one of them.
- I cannot offer any commentary on the caliber of analysts who submit to Exploit-DB. I did note a formal submission process for cataloging, testing, and verifying the exploits received. In this paper, I think Ross et al. were drawing a line of inference from the CVE IDs which may be inherently linked to an Exploit-DB entry (Figure 3) and the associated CVSS score of that vulnerability.
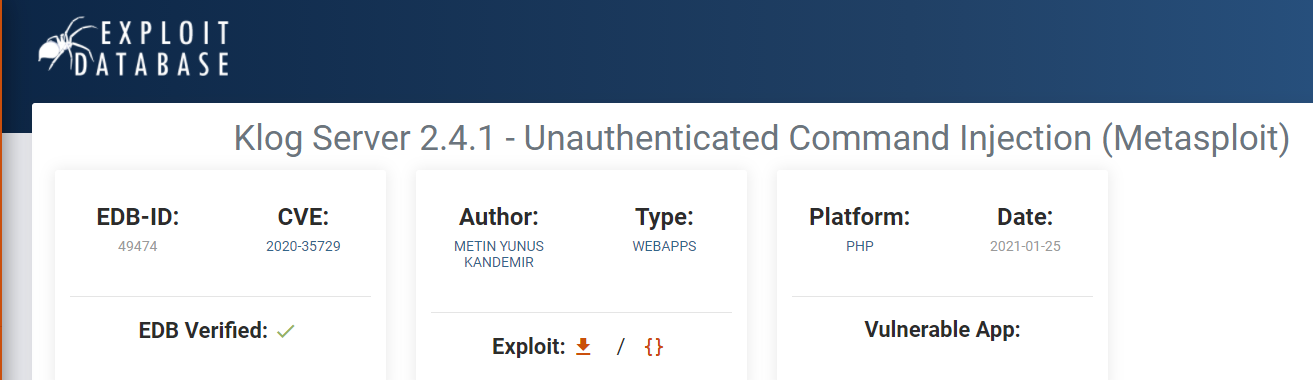 |
| Figure 3: Excerpt from the Exploit Database showing a verified submission which maps to CVE-2020-35729. (Source: https://www.exploit-db.com/exploits/49474) |
- “About 2.7% of the CVE entries in the dataset have an associated exploit, regardless of the CVSS V2 score.” This single sentence is either very poorly written, or it is all the evidence you need that the authors of the paper simply don’t understand vulnerabilities and disclosures. With a simple search of VulnDB, I can tell you at least 55,280 vulnerabilities have a CVE and a public exploit. There were 147,490 live CVE IDs as of last night meaning that is almost 38% that have a public exploit. Not sure how they arrived at 2.7% but that number should have been immediately suspect.
- Here, I think the key caveat is that Ross et al. are referring only to CVE IDs in the Allodi and Massacci dataset and the comparison of those CVE IDs with "exploits" in Exploit-DB and Symantec databases. This is an assumption they stated at the onset.
- “In other words, less than half of the available CVSS V2 vector space had been explored despite thousands of entries…” Well sure, this statement doesn’t qualify one major reason for that. Enumerate all the possible CVSSv2 metric combinations and derive their scores, then look at which numbers don’t show up on that list. A score of 0.1 through 0.7 is not possible for example. Then weed out the combinations that are extremely unlikely to appear in the wild, which is most that have “Au:M” as an example, and it weeds out a lot of possible values.
- Good point regarding the scoring possibilities. My take is that Ross et al. attempted to understand the level of noise present in the CVSS v2 scoring vectors. Next, they applied Jaccard Similarity to the sample set to determine the degree of diversity and similarity in the scoring vector combinations. Subsequently, they identified which of the vector elements (i.e., dimensions for k-means) lead to well-defined clusters for the purpose of ranking vulnerabilities with higher potential for being exploited.
- “Only 17 unique CVSS vectors described 80% of the NVD.” Congrats on figuring out a serious flaw in CVSSv2! Based on the 2.7% figure above, I would immediately question the 80% here too. That said, there is a serious weighting of scores primarily in web application vulnerabilities where e.g. an XSS, SQLi, RFI, LFI, and limited code execution could all overlap heavily.
- The context for unique CVSS vectors is within the Allodi and Massaci dataset. The software applications associated with the CVSS scores were not the focus of the Ross et al. research. The weighting of scores in web application vulnerabilities could be an area for further investigation.
- “Input: Vulnerabilities (e.g., NVD), exploit existence, (e.g., Exploit-DB), the number of clusters k” This is yet another point where they are introducing a dataset they don’t understand and make serious assumptions about. Just because something is posted to EDB does not mean it is a public exploit. Another quick search of VulnDB tells us there are at least 733 EDB entries that are actually not a vulnerability. This goes back to the reliability of the people submitting content to the site.
- I think Ross et al. stated it best when they indicated a research goal to better rank vulnerabilities by identifying CVSS vectors that are highly associated with high risk. They chose to use the "emergence and existence of exploits as a stand-in for risk" and mechanism to evaluate their vulnerability ranking algorithm. The Exploit Database indicates it is a "repository for exploits and proof of concepts." Ross et al. did not offer any insight regarding whether or how their research distinguished between the two use cases.
- “The authors note their approach outperforms CVSS scoring when compared to Exploit-DB.” What does this even mean? Exploit-DB does not do CVSS scoring! How can you compare their approach to a site that doesn’t do it in the first place?
- A few additional details will help clarify the interpretation of these results and my choice of wording. Ross et al. were motivated to "create a system that provides better intelligence for vulnerability mitigation for system administrators than that implied by CVSS scores." Their clustering strategy, where k is the number of clusters, provides a mechanism to prioritize patching by examining the likelihood of a exploit existing for CVE IDs with similar CVSS vectors. Figure 4 was not included in my original paper summary but does appear (Figure 10 in the original paper) as Ross et al. discuss their temporal approach to validate the accuracy of their clustering algorithm over time. In this Figure, the authors show "the cumulative reduction of exploit-associated vulnerabilities in the 2013 calendar year assuming that they are mitigated in priority order using 1) our ten-cluster ordering and 2) CVSS scores 'clustered' by unit-score intervals." The blue line shows that the Ross et al. algorithm which assigns a higher priority to CVE IDs with comparable entries in Exploit-DB will result in more of those same CVE IDs being patched by a system administrator who implements their ranking order. The authors did provide an additional observation for these results noting that "vulnerabilities with CVSS scores v ∊ [7, 8] were the most exploited in 2013, not those with v ∊ [9,10]."
 |
| Figure 4: Mitigating vulnerabilities in priority order via decreasing risk in the latent feature clusters captures more exploit-associated vulnerabilities earlier than by using descending CVSS scores. (Source: Rose et al.) |
The Ross et al. research and Mr. Martin's critique address challenges that persist in creating a viable vulnerability ranking strategy. There are numerous public and proprietary data sets available, each with their own intrinsic value proposition and biases. I have appreciated the opportunity to take a second look at this paper, hear the perspective of an experienced industry practitioner, and gain a better understanding of the subject matter mastery I will need to defend my dissertation when that time arrives. In the following video Mr. Martin sums up the research challenges that I and others, like Ross and et al. from MIT Lincoln Laboratory, will continue to face with vulnerability management.
"No one has a good dataset. We all operating off of very flawed, very incomplete datasets."
-- Brian Martin - AKA Jericho
-- Corren McCoy (@correnmccoy)
Ross, D. M., Wollaber, A. B., & Trepagnier, P. C. (2017, July). Latent feature vulnerability ranking of CVSS vectors. In Proceedings of the Summer Simulation Multi-Conference (pp. 1-12). https://dl.acm.org/doi/10.5555/3140065.3140084
Comments
Post a Comment