 |
| Figure 1: CVSS Score Metrics. (Source: Balbix) |
The Common Vulnerability Scoring System (CVSS) is an open framework for communicating the characteristics and severity of software vulnerabilities. These severity scores, ranging from 0 (low) to 10 (high), have been directly used to prioritize vulnerability mitigation strategies. However, CVSS scores are not strongly linked to known cybersecurity exploits and analysts can be overwhelmed by the volume of vulnerabilities that have similar high scores. This simple ranking approach could be improved if more detailed information on vulnerabilities and exploits were available.
In their paper "Latent feature vulnerability ranking of CVSS vectors", Ross et al. seek to improve upon the CVSS score ranking by exploring the latent feature space described by a Jaccard similarity metric. Their goal is to provide a data-driven and alternative ranking approach using features in the CVSS base and temporal metric groups, Figure 1, enumerated in the National Vulnerability Database (NVD). We should note the analysis conducted by Ross et al. is based upon the CVSS Version 2 scoring system which has since been superseded by CVSS Version 3.1.
Datasets
New vulnerabilities are assigned a CVSS V2 base vector when they are added to the NVD. The CVSS V2 base vectors are comprised of six metrics, each with three categories, evaluated from least to most dangerous. The vectors in Table 1 and Table 2 are converted to a score [0, 10] for vulnerability assessment.
Table 1: Access Metrics and Labels from the NVD. (Source: Ross et al.)
| Metric (Label) |
Value (Label) |
| Attack Vector (AV) |
Local Access (L) |
| Adjacent Network (A) |
| Network (N) |
| Access Complexity (AC) |
High (H) |
| Medium (M) |
| Low (L) |
| Authentication (AU) |
None Required (N) |
| Requires Single (S) |
| Requires Multiple (M) |
Table 2: Impact Metrics and Labels from the NVD. (Source: Ross et al.)
| Metric (Label) |
Value (Label) |
| Confidentiality Impact (C) |
None (N) |
| Partial (P) |
| Complete (C) |
| Integrity Impact (I) |
None (N) |
| Partial (P) |
| Complete (C) |
| Access Impact (A) |
None (N) |
| Partial (P) |
| Complete (C) |
Using the metrics in Table 1 and Table 2,
(AV:N/AC:M/Au:S/C:P/I:P/A:P) is an example of a CVSS V2 vector that might be formulated for a given vulnerability. Ross et al. use four datasets reporting data on vulnerabilities and CVSS scores,
proof-of-concept exploits, exploits traded in the
cyber black markets, and
exploits in the wild.
- National Vulnerability Database (NVD): The NVD is the U.S. government repository for known and accepted software vulnerabilities maintained by the National Institute for Standards and Technology (NIST). Each vulnerability is given a set of analyst-assigned ratings (the CVSS vector) that is used to compute the CVSS base score.
- Exploit Kits Database (EKITS): A database created by Allodi and Massacci that contains exploits for 103 unique vulnerabilities that were purchased on the black market.
- Symantec's Threat Database (SYM): A database extracted from Symantec by Allodi and Massacci that contains references to over 1000 vulnerabilities.
- Exploit Database (Exploit-DB): A robust database containing a large collection of vulnerabilities and their corresponding public exploit(s).
Exploit Probabilities Conditioned on CVSS Scores
The authors developed probabilities of exploit existence conditioned on CVSS score ranges, Equation 1. In their definition,
A is the event that an exploit exists for a particular
CVE-ID.
B is the event that a CVE-ID has a CVSS score. The P(B) is the total number of CVE-IDs that have a CVSS score in a specified range. The P(A∩B) is computed by accumulating the total number of scores in the specified range that also have known exploits.
 |
| Equation 1: Conditional probability of exploit. (Source: Ross et al.) |
Ross et al. note that many exploits exist without associated CVE-IDs. For example, only 9% of the Symantec data is associated with a CVE-ID. The authors offered additional caveats related to their probability calculation.
- Their analysis can only provide a lower bound on the probabilities as only known exploits are included in the data set.
- The conditional probabilities depend on the date range used for the vulnerability and exploit databases. This implies there should be a correlation in the date range chosen.
- Probability estimates must be considered in the context of undirected attacks against many hosts. A determined attacker could develop their own exploits against undiscovered vulnerabilities which would increase the risk and probability associations.
About 2.7% of the CVE entries in the dataset have an associated exploit, regardless of the CVSS V2 score. Only 9.2% of vulnerabilities with CVSS scores in [9, 10] have known exploits. Figure 2 presents the conditional probabilities on an exploit in [V, V+1] where V ranges from 0 to 9. The top subfigure of Figure 2 provides a comparison to the quadratic heuristic introduced by Lippmann et al. which converts a vulnerability's CVSS score to a probability of compromise. The bottom subfigure presents the data alongside a curve fit to a function of the form f(v) = c + avb.
 |
| Figure 2: Conditional probability of an exploit existing with a CVSS V2 score V falling in [V, V +1]. (Source: Ross et. al.) |
Vector Diversity in the NVD
As Tables 1 and 2 suggest, there are 36 = 729 possible CVSS V2 vectors. When this paper was published in 2017, only 283 unique vectors had been observed in the nearly 53,000 NVD entries. In other words, less than half of the available CVSS V2 vector space had been explored despite thousands of entries; much lower than would be expected if vector entries were assigned at random, Figure 3. Additionally, relatively few unique vectors describe the majority of the NVD. Only 17 unique CVSS vectors described 80% of the NVD. Few variations in the discovery rates and type of vulnerabilities are observed year over year, Figure 4.
 |
| Figure 3: The expected number of CVSS V2 vectors with random assignment compared to the cumulative number of unique observed CVSS vectors in the NVD. (Source: Ross et al.) |
 |
| Figure 4: The total number of new unique observed CVSS V2 vectors per year. (Source: Ross et al.) |
Latent Features of CVSS Vectors
Ross et al. observed the NVD has surprisingly few, highly repeated unique CVSS V2 vectors. A mathematical analysis of the latent structure created by the observed vulnerabilities via
spectral clustering with
k-means was conducted. Instead of distance, similarity was computed using a fixed position Jaccard similarity score for every pair of unique CVSS vectors. Note that the labels defined in Tables 1 and 2 are not unique to each metric. Comparisons were made between the two value entries of the same metric in each vector to discern clusters of similar CVSS vectors. As shown in Figure 5, the NVD has surprisingly few, highly repeated unique CVSS V2 vectors.
 |
| Figure 5: In 2014, the entire NVD CVSS V2 vector membership could be described by 283 unique CVSS vectors. Moreover, 80% of the entries could be represented using on 17 vectors, and 90% by only 30 vectors. (Source: Ross et al.) |
CVSS Vector Results
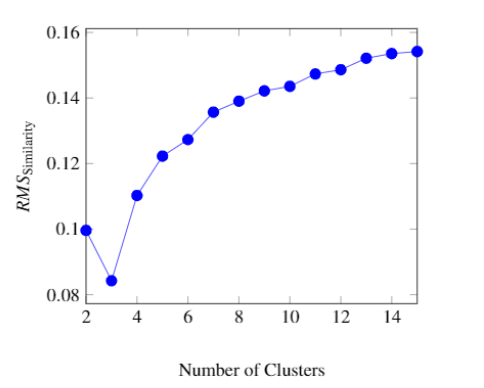
By allowing the number of clusters,
k, to vary as an input parameter, the highest inter-cluster similarity and lowest intra-cluster similarity was found with three clusters. Figure 6 depicts the
root mean square error over the choice of 2 to 15 clusters. Because there are relatively few choices for CVSS vectors, when the number of clusters is increased, the inter-cluster similarity is high which drives up the error.
 |
Figure 6: Root Mean Square (RMS) similarity value exhibited for each of k cluster choices for k⋜15. (Source Ross et al.)
|
A representation of the clustering is shown in Figure 7. The rows and columns are shaded according to cluster membership, where the darker colors represent higher similarity.
 |
Figure 7: CVSS V2 vectors with three clusters from Jaccard similarity arranged by cluster membership. Darker blue entries are more similar. (Source: Ross et al.)
|
Several important observations can be made regarding the CVSS vectors. Table 3 depicts the cluster membership across the six CVSS vectors. It is noteworthy that
Access Complexity (AC) is nearly uniform across all three clusters so it is a poor discriminator.
Authentication (AU) is most severe in cluster 2, least in cluster 1, and moderate in cluster 0. We also see that C/I/A values are tightly coupled for the lowest membership vectors. Cluster 2 has very few medium scoring C/I/A entries while clusters 0 and 1 have very few high scoring entries.
 |
| Table 3: Cluster membership fractions for CVSS V2 vectors in three clusters. (Source: Ross et al.) |
Applications of CVSS Clustering
The existence of well-defined clusters of CVSS vectors motivated Ross et al. to create a system that provides better intelligence for vulnerability mitigation. To better rank vulnerabilities, the authors identify vectors that are highly associated, now or in the future, with high risk. For clustering rankings, they leverage exploits from the SYM and EKITS datasets and their corresponding CVSS vectors.
Cluster-based Ranking
The clusters within the CVSS vector data do not immediately provide a better ranking of vulnerabilities since they merely model the latent relationship between the CVSS metrics. To provide an actionable ranking, Ross et al. parameterize the number of clusters noting each value of k can be used to re-assign cluster membership. In Figure 8, they explore the number of exploits per cluster member to determine which clusters are most highly exploited. Averaging is used to find clusters where exploits are more or less dense.
 |
| Figure 8: Average number of exploits per vulnerability for each cluster. (Source: Ross et al.) |
A large exploit-to-CVSS-vector ratio is desirable when considered in parallel with the principle of transduction. Transduction leverages known latent information in one space to explain the latent behavior in another space (i.e., emergence of exploits). Transduction is achieved when the CVSS vectors with exploits are clustered with CVSS vectors that will develop exploits in the future. Choosing the number of clusters correctly drives this process. The underlying clustering algorithm is defined as:
Input: Vulnerabilities (e.g., NVD), exploit existence, (e.g., Exploit-DB), the number of clusters k
- Find all unique CVSS vectors in the vulnerability database
- Compute the Jaccard similarity between all pairs to create the similarity matrix, S
- Apply spectral clustering with k-means on S to provide k-many clusters
- Count the number of exploits affecting each CVSS vector in the cluster
- Rank the clusters 1 to k where k has the most exploits
Output: The vulnerabilities corresponding to the CVSS vectors in clusters ranked from
k to 1.
Temporal Exploit Emergence
To provide validation of their algorithm's accuracy over time, Ross et al. observed vulnerabilities and exploits for a period of time, built a model, and then measured the emergence of new exploits at intervals of six months, one year, and two years. Figure 9 shows the cumulative reduction in exploit-associated vulnerabilities assuming they are mitigated (i.e., patched) in priority order. The authors note their approach outperforms CVSS scoring when compared to Exploit-DB. They also observed similar performance with traditional ranking methods once six clusters are mitigated. This observation indicates that low-scoring vulnerabilities and low-ranked clusters have few exploits.
 |
Figure 9: Mitigating vulnerabilities in priority order via decreasing risk in the latent feature clusters captures more exploit-associated vulnerabilities earlier than by using descending CVSS scores.
(Source: Ross et al.) |
Summary Discussion
Ross et al. provided a data-driven analysis to present improvements to existing vulnerability ranking systems by tying exploits to the risk presented by the vulnerability. They determined the conditional probability is given by a functional fit to a
power law with an exponent of 7.5±1.4 with a maximum probability of just over 9%. The authors were also motivated to analyze the NVD's latent feature space by observing the emergence of CVSS V2 vectors. In particular, they determined 80% of the NVD entries can be described using only 17 vectors. Using spectral and
k-means, Ross et al. observed that three clusters suitably capture the CVSS vector feature spaces within the NVD. Finally, the authors conclude their rank-ordering of CVSS vectors is superior to that implied by CVSS scores when exploits are used as a stand-in for risk. For future work, they plan to incorporate other vulnerability features and determine applicability to the more recent CVSS V3 scoring metrics.
-- Corren McCoy (@correnmccoy)
Ross, D. M., Wollaber, A. B., & Trepagnier, P. C. (2017, July).
Latent feature vulnerability ranking of CVSS vectors. In Proceedings of the Summer Simulation Multi-Conference (pp. 1-12).
https://dl.acm.org/doi/10.5555/3140065.3140084
Lippmann, R. P., Riordan, J. F., Yu, T. H., & Watson, K. K. (2012). Continuous security metrics for prevalent network threats: introduction and first four metrics (No. MIT-LL-IA-3). Massachusetts Inst of Tech Lexington Lincoln Lab.


Comments
Post a Comment