2019-10-25: Summary of "Proactive Identification of Exploits in the Wild Through Vulnerability Mentions Online"
 |
| Figure 1 Disclosed Vulnerabilities by Year (Source: CVE Details) |
The number of software vulnerabilities discovered and disclosed to the public is steadily increasing every year. As shown in Figure 1, in 2018 alone, more than 16,000 Common Vulnerabilities and Exposures (CVE) identifiers were assigned by various CVE Numbering Authorities (CNA). CNAs are organizations from around the world that are authorized to assign CVE IDs to vulnerabilities affecting products within their distinct, agreed-upon scope. In the presence of voluminous amounts of data and limited skilled cyber security resources, organizations are challenged to identify the vulnerabilities that pose the greatest risk to their technology resources.
One of the key reasons the current approaches to cyber vulnerability remediation are ineffective is that organizations cannot effectively determine whether a given vulnerability poses a meaningful threat. In their paper, "Proactive Identification of Exploits in the Wild Through Vulnerability Mentions Online", Almukaynizi et al. draw on a body of work that seeks to define an exploit prediction model that leverages data from online sources generated by the white-hat community (i.e., ethical hackers). The white-hat data is combined with vulnerability mentions scraped from the dark web to provide an early predictor of exploits that could appear "in the wild" (i.e., real world attacks).
Video: What is the dark web? And, what will you find there? (Source: https://youtu.be/7QxzFbrrswA)
Common Vulnerability Scoring System (CVSS) Explained
The CVSS is a framework for rating the severity of security vulnerabilities in software and hardware. Operated by the Forum of Incident Response and Security Teams (FIRST), the CVSS uses an publicly disclosed algorithm to determine three severity rating scores: Base, Temporal, and Environmental. The scores are numeric and range from 0.0 through 10.0 with 10.0 being the most severe. According to the most recent version of the CVSS, V3.0:
- A score of 0.0 receives a "None" rating.
- A 0.1-3.9 score receives a "Low" severity rating.
- A score of 4.0-6.9 receives a "Medium" rating.
- A score of 7.0-8.9 receives a "High" rating.
- A score of 9.0 - 10.0 receives a "Critical" rating.
- The Base score is the metric most relied upon by enterprise organizations and reflects the inherent qualities of a vulnerability.
- The Temporal score represents the qualities of the vulnerability that change over time.
- The Environmental score represents the qualities of the vulnerability that are specific to the affected user's environment.
 |
| Figure 2 CVSS Metric Groups (Source: FIRST) |
Due to their specificity with the organization's environment, it should be noted the temporal and environmental metrics are normally not reflected in the reported CVSS base score, but can be calculated independently using the equations published in the FIRST Common Vulnerability Scoring V3.1 Specification document. The CVSS allows organizations to prioritize which vulnerabilities to remediate first and gauge the overall impact of the vulnerabilities on their systems. A consistent finding in this stream of research is that the status quo for how organizations address vulnerability remediation is often less than optimal and has significant room for improvement. With that in mind, Almukaynizi et al. present an alternative prediction model which they evaluate against the standard CVSS methodology.
Exploit Prediction Model
Figure 3 depicts the individual elements that Almukaynizi et al. use to describe the three phases of their exploit prediction model. The phases are Data Collection, Feature Extraction, and Prediction.
 |
| Figure 3 Exploit Prediction Model (Source: Almukaynizi) |
This phase is used to build a dataset for further analysis. Vulnerability data is assimilated from:
- NVD. 12,598 vulnerabilities (unique CVE IDs) were disclosed and published in the National Vulnerability Database (NVD) between 2015 and 2016. For each vulnerability, the authors gathered the description, CVSS base score, and scoring vector.
- EDB (white-hat community). Exploit Database is an archive of public, proof of concept (PoC) exploits and corresponding vulnerable software, developed for use by penetration testers and vulnerability researchers. The PoC exploits can often be mapped to a CVE ID. Using the unique CVE-IDs from the NVD database for the time period between 2015 and 2016, the authors queried the EDB to determine whether a PoC exploit was available. 799 of the vulnerabilities in the 2015 to 2016 data set were found to have verified PoC exploits. For each PoC, the authors gathered the date the PoC exploit was posted.
- ZDI (vulnerability detection community). The Zero Day Initiative (ZDI) encourages the reporting of verified zero-day vulnerabilities privately to the affected vendors by financially rewarding researchers; a process which is sometimes referred to as a bug bounty. The authors queried this database to identify 824 vulnerabilities in the 2015 to 2016 data set that were common with the NVD.
- DW (black-hat community). The authors built a system which crawls marketplace sites and forums on the dark web to collect data related to malicious hacking. They used a machine learning approach to identify content of interest and exclude irrelevant postings (e.g., pornography). They retained any postings which specifically have a CVE number or could be mapped from a Microsoft Security Bulletin to a corresponding CVE ID. They found 378 unique CVE mentions between 2015 and 2016.
- Attack Signatures (Ground truth). Symantec's anti-virus and intrusion detection attack signatures were used to identify actual exploits that were used in the wild and not just PoC exploits. Some attack signatures are mapped to the CVE ID of the vulnerability which were correlated with NVD, EDB, ZDI, and DW. The authors noted this database may be biased towards products from certain vendors (e.g., Microsoft, Adobe).
Table I shows the number of vulnerabilities exploited as compared to the ones disclosed for all the data sources considered.
 |
| Source: Almukaynizi |
A summary of features extracted from all the data sources mentioned is provided in Table II.
 |
| Source: Almukaynizi |
- The NVD description provides information on the vulnerability and the capabilities attackers will gain if they exploit it. Contextual information gleaned from DW was appended to the NVD description. Here, the authors observed foreign languages in use which they translated into English using the Google Translate API. The text features were analyzed using Term Frequency-Inverse Document Frequency (TF-IDF) to create a vocabulary of 1000 most frequent words in the entire data set. Common words were eliminated as important features.
- The NVD provides CVSS base scores and vectors which indicate the severity of the vulnerability. The categorical components of the vector include Access Complexity, Authentication, Confidentiality, Integrity, and Availability. All possible categories of features were vectorized then assigned a value of "1" or "0" to denote whether the category is present or not.
- The DW feeds are posted in different languages; most notably in English, Chinese, Russian, and Swedish. The language of the DW post is used rather than the description since important information can be lost during the translation process.
- The presence of PoC on either EDB, DW, or ZDI increases the likelihood of a vulnerability being exploited. This is treated as a binary feature.
The authors employed several supervised machine learning approaches to determine a binary classification on the selected features indicating whether the vulnerability would be exploited or not.
As shown in Table III, Almukaynizi et al. assessed the importance of aggregating disparate data sources by first analyzing the likelihood of exploitation based on the coverage of each source. Then, they conducted a language based analysis to identify any socio-cultural factors present in the DW sites which might influence exploit likelihood. Table III presents the percentage of exploited vulnerabilities that appeared in each source along with results for the intersection.
The authors determined that 2.4% of the vulnerabilities disclosed in the NVD are exploited in the wild. The correct prediction of exploit likelihood increased when additional data sources were included. This was balanced by the fact that each data community (EDB, ZDI, DW) operates under a distinct set of guidelines (e.g., white hat, researchers, hackers).
In the DW, four languages were detected which resulted in noticeable variations in the exploit likelihood. English and Chinese have more vulnerability mentions (n=242 and n= 112, respectively) than Russian and Swedish (n=13 and n=11, respectively). Chinese postings exhibited the lowest exploitation rate (~10%). However, 46% of the vulnerabilities mentioned in Russian postings were exploited. Figure 4 shows the language analysis based on vulnerability mentions.
Performance Evaluation
Experiments using the exploit prediction model were examined using different supervised machine learning algorithms including Support Vector Machine (SVM), Random Forest (RF), Naive Bayes Classifier (NB), and Logistic Regression (LOG-REG). Random Forest, which is based on generating multiple decision trees, was found to provide the best F1 measure to determine classes of exploited versus not exploited vulnerabilities.
Their classifier was evaluated based on precision, recall, and Receiver Operating Characteristics (ROC). If minimizing the number of incorrectly flagged vulnerabilities is the goal, then high precision is desired. If minimizing the number of undetected vulnerabilities is the goal, then high recall is desired. To avoid temporal intermixing, the NVD data was sorted by the disclosure date and the first 70% was used for training and the rest for testing. This was necessary so that future PoC events would not influence the prediction of past events (i.e., vulnerability is published before the exploitation date). Table IV shows the precision, recall, and corresponding F1 measure for vulnerabilities mentioned on DW, ZDI, and EDB. DW information was able to identify exploited vulnerabilities with the highest level of precision at 0.67.
Discussion
Almukaynizi et al. indicate promising results based on their random forest classification scheme. It should be noted that random forest outputs a confidence score for each sample which can be evaluated against a user-defined threshold for predicting a vulnerability as exploited. While the authors acknowledge the threshold can be varied in accordance with other factors of importance to the organization (e.g., vendors), they do not disclose the hard-cut threshold used during their experiments. It is also noteworthy that false negatives that received the lowest confidence scores shared common features (e.g., Adobe Flash and Acrobat Reader), base scores, and similar descriptions in the NVD. A similar observation was noted among the false positives where all predicted exploited vulnerabilities existed in Microsoft products. The inherent class imbalance in vulnerability data may also be a contributing factor along with perceived biases in the Symantec attack signatures which provide ground truth. In the future, the authors hope to enhance their exploit prediction model by expanding the vulnerability data sources to include social media sites and online blogs.
-- Corren McCoy (@correnmccoy)
Almukaynizi, Mohammed, et al. "Proactive identification of exploits in the wild through vulnerability mentions online." 2017 International Conference on Cyber Conflict (CyCon US). IEEE, 2017. http://usc-isi-i2.github.io/papers/almukaynizi17-cycon.pdf
As shown in Table III, Almukaynizi et al. assessed the importance of aggregating disparate data sources by first analyzing the likelihood of exploitation based on the coverage of each source. Then, they conducted a language based analysis to identify any socio-cultural factors present in the DW sites which might influence exploit likelihood. Table III presents the percentage of exploited vulnerabilities that appeared in each source along with results for the intersection.
Table III
| EDB | ZDI | DW | ZDI V DW | EDB V ZDI V DW | |
|---|---|---|---|---|---|
| Number of vulnerabilities | 799 | 824 | 378 | 1180 | 1791 |
| Number of exploited vulnerabilities | 74 | 95 | 52 | 140 | 164 |
| Percentage of exploited vulnerabilities | 21% | 31% | 17% | 46% | 54% |
| Percentage of total vulnerabilities | 6.3% | 6.5% | 3.0% | 9.3% | 14.2% |
Source: Almukaynizi
The authors determined that 2.4% of the vulnerabilities disclosed in the NVD are exploited in the wild. The correct prediction of exploit likelihood increased when additional data sources were included. This was balanced by the fact that each data community (EDB, ZDI, DW) operates under a distinct set of guidelines (e.g., white hat, researchers, hackers).
In the DW, four languages were detected which resulted in noticeable variations in the exploit likelihood. English and Chinese have more vulnerability mentions (n=242 and n= 112, respectively) than Russian and Swedish (n=13 and n=11, respectively). Chinese postings exhibited the lowest exploitation rate (~10%). However, 46% of the vulnerabilities mentioned in Russian postings were exploited. Figure 4 shows the language analysis based on vulnerability mentions.
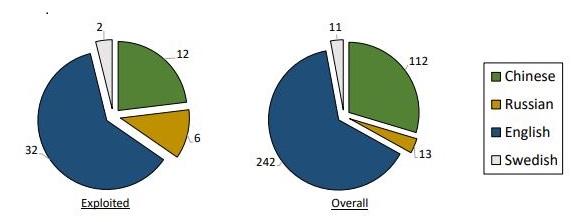 |
| Figure 4 Exploited Vulnerabilities by Language (Source: Almukaynizi) |
Experiments using the exploit prediction model were examined using different supervised machine learning algorithms including Support Vector Machine (SVM), Random Forest (RF), Naive Bayes Classifier (NB), and Logistic Regression (LOG-REG). Random Forest, which is based on generating multiple decision trees, was found to provide the best F1 measure to determine classes of exploited versus not exploited vulnerabilities.
Their classifier was evaluated based on precision, recall, and Receiver Operating Characteristics (ROC). If minimizing the number of incorrectly flagged vulnerabilities is the goal, then high precision is desired. If minimizing the number of undetected vulnerabilities is the goal, then high recall is desired. To avoid temporal intermixing, the NVD data was sorted by the disclosure date and the first 70% was used for training and the rest for testing. This was necessary so that future PoC events would not influence the prediction of past events (i.e., vulnerability is published before the exploitation date). Table IV shows the precision, recall, and corresponding F1 measure for vulnerabilities mentioned on DW, ZDI, and EDB. DW information was able to identify exploited vulnerabilities with the highest level of precision at 0.67.
| Table IV |
 Source: Almukaynizi |
Almukaynizi et al. indicate promising results based on their random forest classification scheme. It should be noted that random forest outputs a confidence score for each sample which can be evaluated against a user-defined threshold for predicting a vulnerability as exploited. While the authors acknowledge the threshold can be varied in accordance with other factors of importance to the organization (e.g., vendors), they do not disclose the hard-cut threshold used during their experiments. It is also noteworthy that false negatives that received the lowest confidence scores shared common features (e.g., Adobe Flash and Acrobat Reader), base scores, and similar descriptions in the NVD. A similar observation was noted among the false positives where all predicted exploited vulnerabilities existed in Microsoft products. The inherent class imbalance in vulnerability data may also be a contributing factor along with perceived biases in the Symantec attack signatures which provide ground truth. In the future, the authors hope to enhance their exploit prediction model by expanding the vulnerability data sources to include social media sites and online blogs.
-- Corren McCoy (@correnmccoy)
Almukaynizi, Mohammed, et al. "Proactive identification of exploits in the wild through vulnerability mentions online." 2017 International Conference on Cyber Conflict (CyCon US). IEEE, 2017. http://usc-isi-i2.github.io/papers/almukaynizi17-cycon.pdf
Comments
Post a Comment