2017-06-09: InfoVis Spring 2016 Class Projects
I'm way behind in posting about my Spring 2016 offering of CS 725/825 Information Visualization, but better late than never. (Previous semester highlights posts: Spring 2015, Spring/Fall 2013, Fall 2012, Fall 2011)
Here are a few projects that I'd like to highlight. (All class projects are listed in my InfoVis Gallery.)
Expanding the WorldVis Simulation
Created by Juliette Pardue, Mridul Sen, Christos Tsolakis

This project (available at http://ws-dl.cs.odu.edu/vis/world-vis/) was an extension of the FluNet visualization, developed as a class project in 2013. The students extended the specialized tool to account for general datasets of quantitative attributes per country over time and added attributes based on continent average. They also computed summary data for each dataset for each year, so at a glance, the user can see statistical information including the country with the minimum and maximum value.
This work was accepted as a poster to IEEE VIS 2016:
Visualization for Navy Hearing Conservation Program (HCP)
Created by Erika Siregar (@erikaris), Hung Do (@hdo003), Srinivas Havanur

This project (available at http://www.cs.odu.edu/~hdo/InfoVis/navy/final-project/index.html) was also the extension of previous work. The first version of this visualization was built by Lulwah Alkwai.
The aim of this work is to track hearing level of workers in the US Navy over a period of time through Hearing Conservation Program (HCP). The HCP's goal is to detect and prevent a noise-induced hearing loss among the service members by analyzing their hearing levels over the years. The students analyzed the data obtained from the audiogram dataset to produce some interactive visualizations using D3.js to see hearing curves of workers over the years.
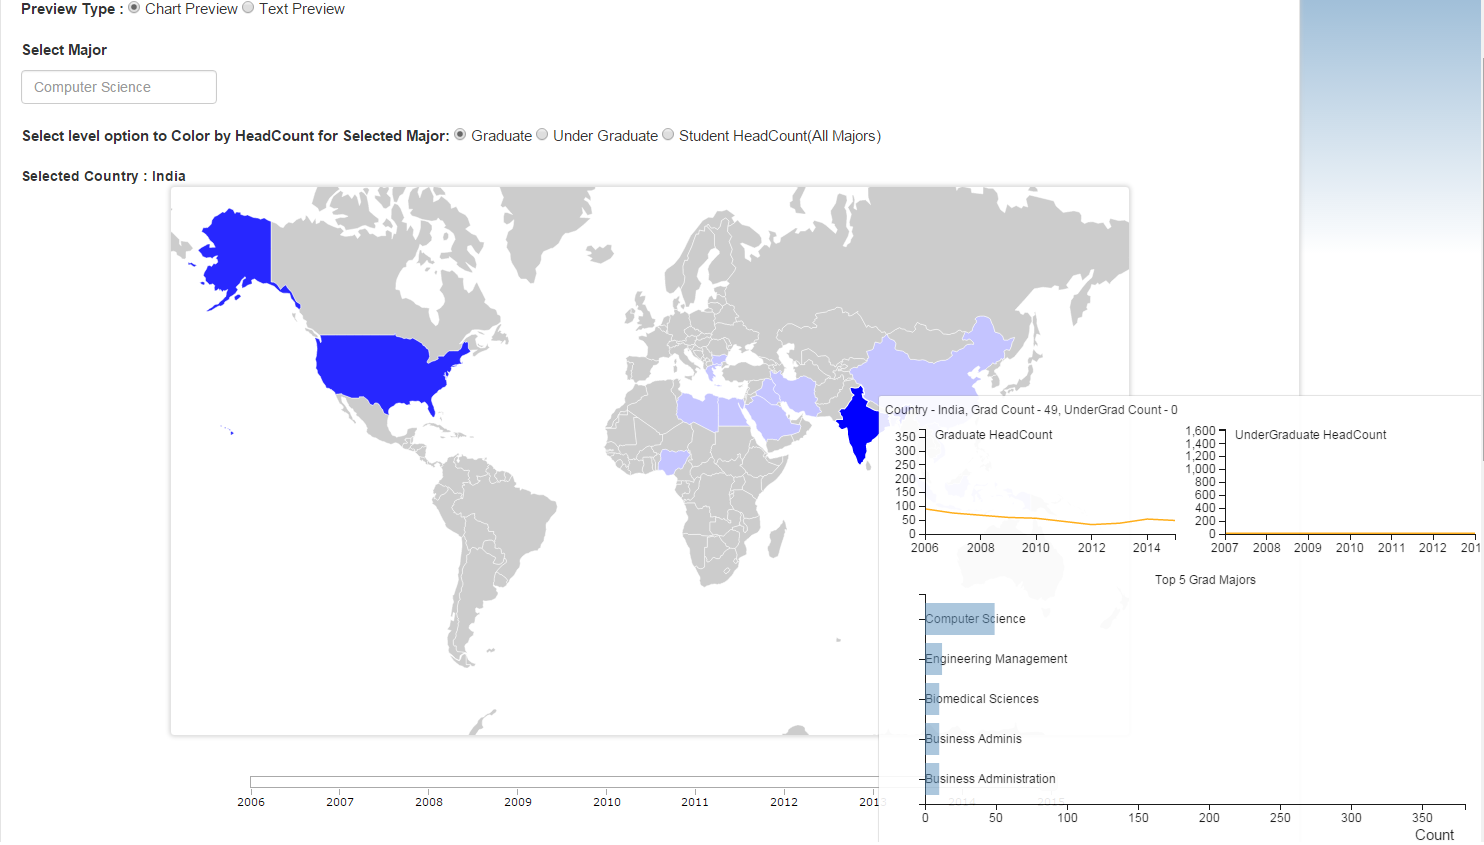
ODU Student Demographics
Created by Ravi Majeti, Rajyalakshmi Mukkamala, Shivani Bimavarapu
 This project (available at http://webspace.cs.odu.edu/~nmajeti/InfoViz/World/worldmap-template.html) concentrates on ODU international student information. It visualizes the headcount of international graduate and undergraduate students studying at ODU for each country for a particular major in a selected year and visualizes the gender ratio for undergraduate and graduate students in the university for each year. The main goal is to provide an interactive interface for the prospective students to analyze the global diversity at ODU and identify whether ODU best suits their expectations in the aspects of alumni from their respective major and country.
Visualizing Web Archives of Moderate Size
Created by John Berlin (@johnaberlin), Joel Rodriguez-Ortiz, Dan Milanko

This work (available at http://jrodgz.github.io/project/), develops a platform for understanding web archives in a multi-user setting. The students used contextual data provided during the archival process to provide a new approach towards identifying the general state of the archives. This metadata allows us to identify the most common domains, archived resources, times and tags associated with a web collection. The designed tool outlines the most important areas of focus in web archives and gives users a more clear picture of what their collections comprise of, both in specific and general terms.
-Michele
Here are a few projects that I'd like to highlight. (All class projects are listed in my InfoVis Gallery.)
Expanding the WorldVis Simulation
Created by Juliette Pardue, Mridul Sen, Christos Tsolakis

This project (available at http://ws-dl.cs.odu.edu/vis/world-vis/) was an extension of the FluNet visualization, developed as a class project in 2013. The students extended the specialized tool to account for general datasets of quantitative attributes per country over time and added attributes based on continent average. They also computed summary data for each dataset for each year, so at a glance, the user can see statistical information including the country with the minimum and maximum value.
This work was accepted as a poster to IEEE VIS 2016:
Juliette Pardue, Mridul Sen, Christos Tsolakis, Reid Rankin, Ayush Khandelwal and Michele C. Weigle, "WorldVis: A Visualization Tool for World Data," In Proceedings of IEEE VIS. Baltimore, MD, October 2016, poster abstract. (PDF, poster, trip report blog post)
Visualization for Navy Hearing Conservation Program (HCP)
Created by Erika Siregar (@erikaris), Hung Do (@hdo003), Srinivas Havanur
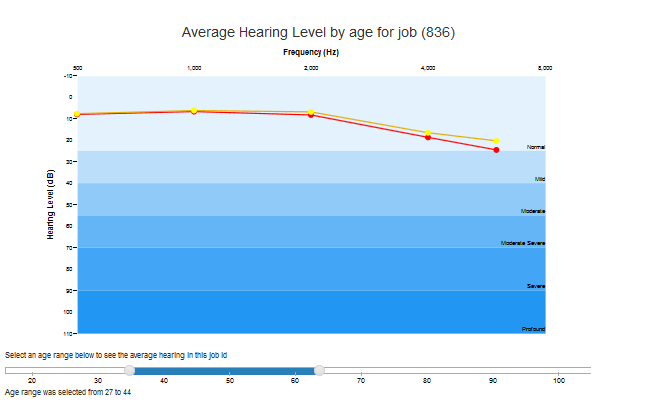
This project (available at http://www.cs.odu.edu/~hdo/InfoVis/navy/final-project/index.html) was also the extension of previous work. The first version of this visualization was built by Lulwah Alkwai.
The aim of this work is to track hearing level of workers in the US Navy over a period of time through Hearing Conservation Program (HCP). The HCP's goal is to detect and prevent a noise-induced hearing loss among the service members by analyzing their hearing levels over the years. The students analyzed the data obtained from the audiogram dataset to produce some interactive visualizations using D3.js to see hearing curves of workers over the years.
ODU Student Demographics
Created by Ravi Majeti, Rajyalakshmi Mukkamala, Shivani Bimavarapu
Visualizing Web Archives of Moderate Size
Created by John Berlin (@johnaberlin), Joel Rodriguez-Ortiz, Dan Milanko
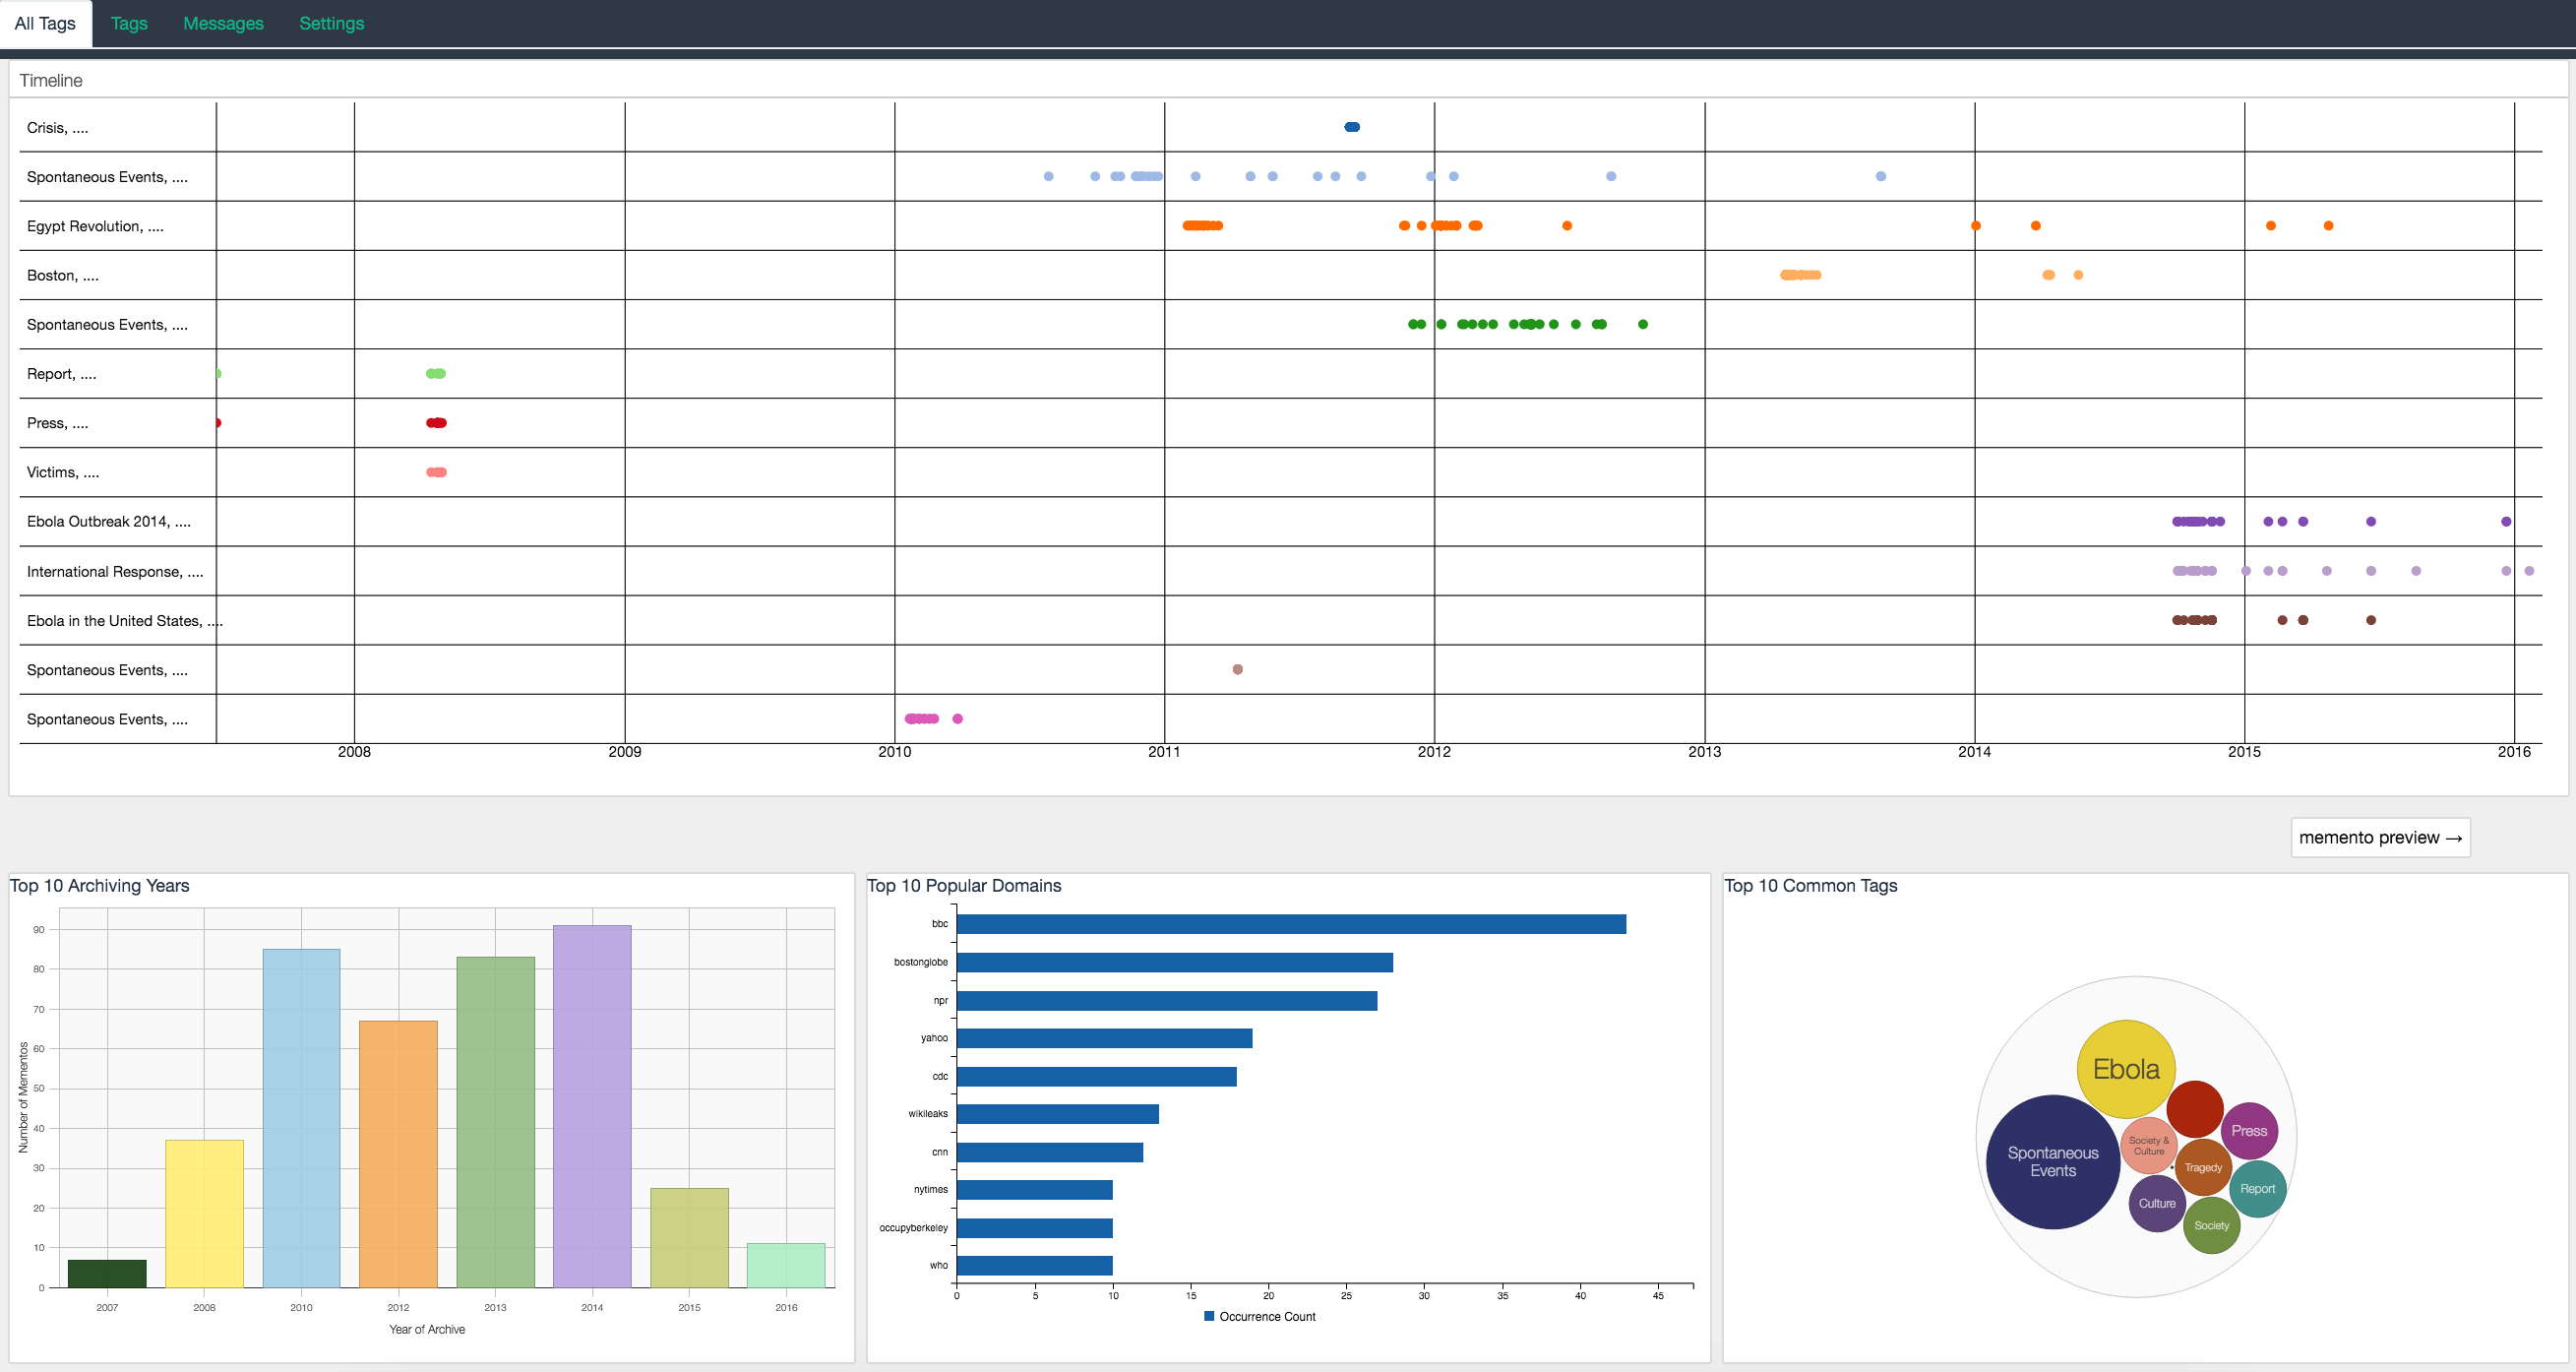
This work (available at http://jrodgz.github.io/project/), develops a platform for understanding web archives in a multi-user setting. The students used contextual data provided during the archival process to provide a new approach towards identifying the general state of the archives. This metadata allows us to identify the most common domains, archived resources, times and tags associated with a web collection. The designed tool outlines the most important areas of focus in web archives and gives users a more clear picture of what their collections comprise of, both in specific and general terms.
-Michele
Comments
Post a Comment