2014-06-26: InfoVis Fall 2011 Class Projects
(Note: This is continuing a series of posts about visualizations
created either by students in our research group or in our classes.)
I've been teaching the graduate Information Visualization course (then CS 795/895, now CS 725/825) since Fall 2011. Each semester, I assign an open-ended final project that asks students to create an interactive visualization of something they find interesting. Here's an example of the project assignment. In this series of blog posts, I want to highlight a few of the projects from each course offering. Some of these projects are still active and available for use, while others became inactive after their creators graduated.
The following projects are from the Fall 2011 semester. Both Sawood and Corren are PhD students in our group. Another nice project from this semester was done by our PhD student Yasmin AlNoamany and MS alum Kalpesh Padia. The project led directly to Kalpesh's MS Thesis, which has its own blog post. (All class projects are listed in my InfoVis Gallery.)
K-12 Archive Explorer
Created by Sawood Alam and Chinmay Lokesh
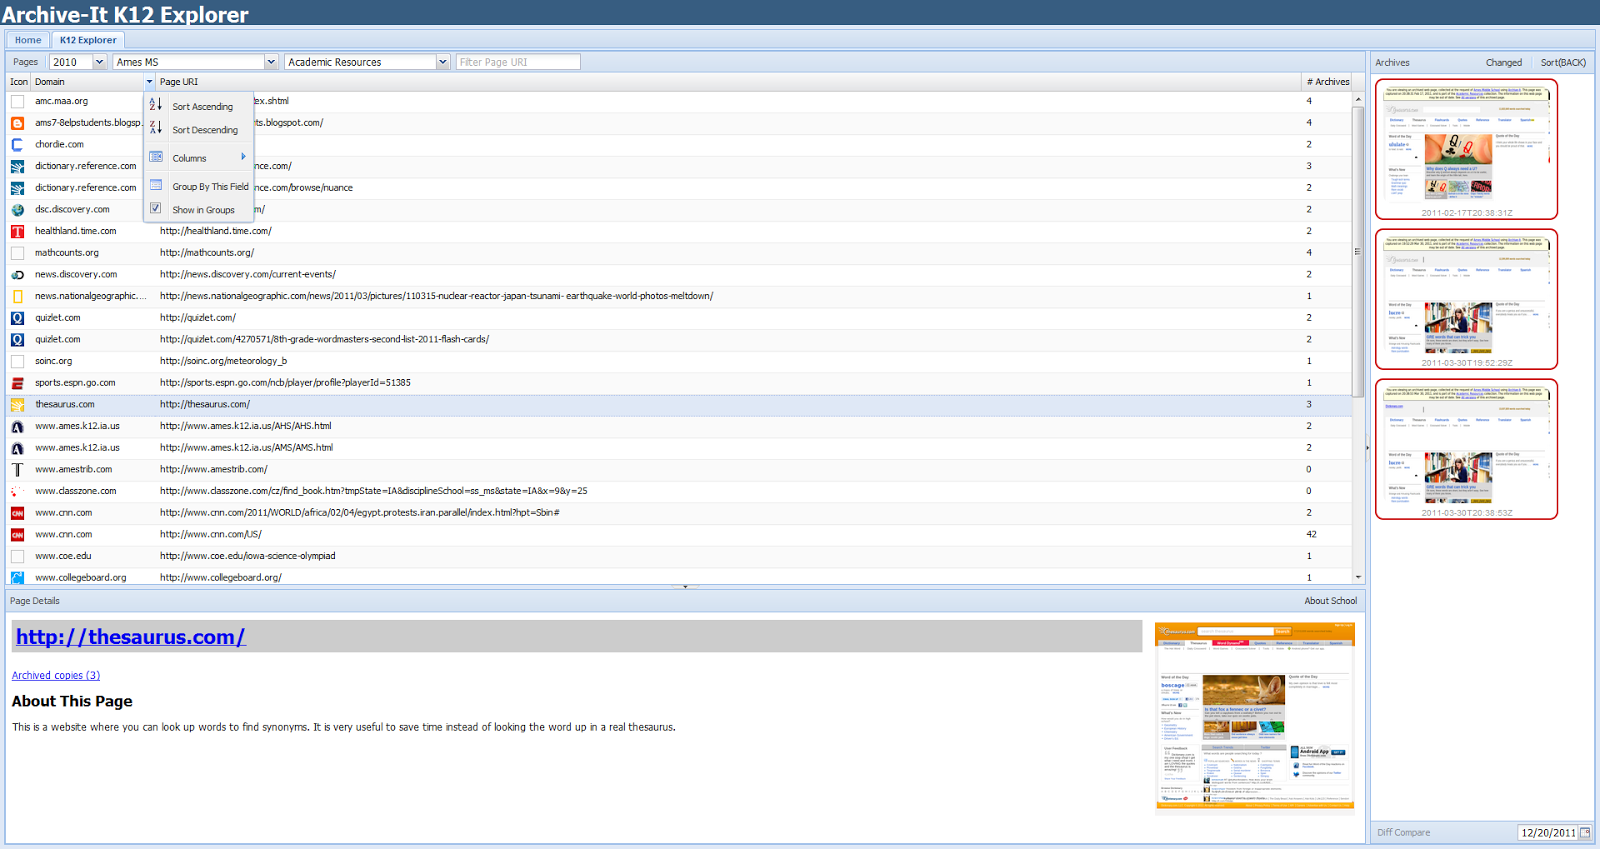
The K-12 Web Archiving Program was developed for high schools in partnership with the Archive-It team at the Internet Archive and the Library of Congress. The program has been active since 2008 and allows students to capture web content to create collections that are archived for future generations. The visualization helps to aggregate this vast collection of information. The explorer (currently available at http://k12arch.herokuapp.com/) provides users with a single interface for fast exploration and visualization of the K-12 archive collections.
The video below provides a demo of the tool.
We Feel Fine: Visualizing the Psychological Valence of Emotions
Created by Corren McCoy and Elliot Peay


This work was inspired by the "We Feel Fine" project by Jonathan Harris and Sep Kamvar. The creators harvested blog entries for occurrences of the phrases "I feel" and "I am feeling" to determine the emotion behind the statement. They collected and maintained a database of several million human feelings from prominent websites such as Myspace and Flickr. This work uses the "We Feel Fine" data to measure the nature and intensity of a person’s emotional state as noted in the emotion-laden sentiment of individual blog entries. The specific words in the blogs related to feelings are rated on a continuous 1 to 9 scale using a psychological valence score to determine the degree of happiness. This work also incorporates elements of a multi-dimensional color wheel of emotions popularized by Plutchik to visually show the similarities between words. For example, happy positive feelings are bright yellow, while sad negative feelings are dark blue. The final visualization method combines a standard histogram which describes the emotional states with an embedded word frequency bar chart. We refer to this visualization technique as a "valence bar" which allows us to compare not only how the words used to express emotion have changed over time, but how this usage differs between men and women.
The video below shows a screencast highlighting how the valence bars change for different age groups and different years.
-Michele
I've been teaching the graduate Information Visualization course (then CS 795/895, now CS 725/825) since Fall 2011. Each semester, I assign an open-ended final project that asks students to create an interactive visualization of something they find interesting. Here's an example of the project assignment. In this series of blog posts, I want to highlight a few of the projects from each course offering. Some of these projects are still active and available for use, while others became inactive after their creators graduated.
The following projects are from the Fall 2011 semester. Both Sawood and Corren are PhD students in our group. Another nice project from this semester was done by our PhD student Yasmin AlNoamany and MS alum Kalpesh Padia. The project led directly to Kalpesh's MS Thesis, which has its own blog post. (All class projects are listed in my InfoVis Gallery.)
K-12 Archive Explorer
Created by Sawood Alam and Chinmay Lokesh
The K-12 Web Archiving Program was developed for high schools in partnership with the Archive-It team at the Internet Archive and the Library of Congress. The program has been active since 2008 and allows students to capture web content to create collections that are archived for future generations. The visualization helps to aggregate this vast collection of information. The explorer (currently available at http://k12arch.herokuapp.com/) provides users with a single interface for fast exploration and visualization of the K-12 archive collections.
The video below provides a demo of the tool.
We Feel Fine: Visualizing the Psychological Valence of Emotions
Created by Corren McCoy and Elliot Peay
This work was inspired by the "We Feel Fine" project by Jonathan Harris and Sep Kamvar. The creators harvested blog entries for occurrences of the phrases "I feel" and "I am feeling" to determine the emotion behind the statement. They collected and maintained a database of several million human feelings from prominent websites such as Myspace and Flickr. This work uses the "We Feel Fine" data to measure the nature and intensity of a person’s emotional state as noted in the emotion-laden sentiment of individual blog entries. The specific words in the blogs related to feelings are rated on a continuous 1 to 9 scale using a psychological valence score to determine the degree of happiness. This work also incorporates elements of a multi-dimensional color wheel of emotions popularized by Plutchik to visually show the similarities between words. For example, happy positive feelings are bright yellow, while sad negative feelings are dark blue. The final visualization method combines a standard histogram which describes the emotional states with an embedded word frequency bar chart. We refer to this visualization technique as a "valence bar" which allows us to compare not only how the words used to express emotion have changed over time, but how this usage differs between men and women.
The video below shows a screencast highlighting how the valence bars change for different age groups and different years.
-Michele
Comments
Post a Comment