2023-08-30: Summary of "Supporting Accessible Data Visualization Through Audio Data Narratives"
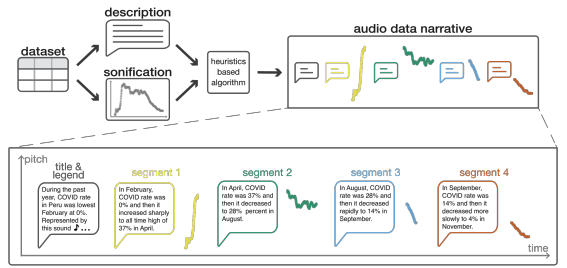
Figure 1: A proposed heuristics-based approach to automatically generate a narrative given a time-series dataset (Figure 1 in Siu et al.)
The use of online data visualizations is becoming more crucial in informing the public and aiding decision-making. However, most guidelines and tools for creating these visualizations are centered around visuals, leaving little consideration for screen reader users who rely on non-visual methods to access data. As a result, there needs to be more exploration of alternative representations that cater to their needs. In the paper “Supporting Accessible Data Visualization Through Audio Data Narratives,”, published at CHI 2022 conference, Siu et al. introduced audio data narratives and accessible data representation for screen reader users that use image descriptions and sonification to provide direct, multimodal, and up-to-date access to data. These narratives employ image descriptions and sonification to offer direct, multimodal, and real-time access to data. The author created an automated audio data story generation system for time-series datasets, incorporating design principles from co-design workshops and previous research on auditory perception. [An overview of our approach is shown in Figure 1].
Study Overview
The authors conducted two co-design studies to explore the potential of audio data narratives and co-design in enhancing the navigation and interpretation of audio graphics. Four participants, who were visually impaired and primarily used screen readers, took part in remote sessions repeatedly. During these sessions, they collaborated to generate ideas on effective narrative design patterns, leading to the development of design guidelines.
The author identified two key commonalities among prototypes developed during the design workshops. Firstly, users preferred organizing information in the auditory narrative by segmenting the sonification based on prominent features, making it easier to identify, review, and remember different parts when listening sequentially, especially for complex datasets. Secondly, users desired coordinated access between the description and sonification, with the speech providing commentary on upcoming sonification's prominent features. This context helped users anticipate the audio content and interpret the sounds more effectively.
With an understanding of how to effectively guide the design of a data narrative, the author applied insights to develop an automatic approach to generate audio data narratives. They used a heuristics based approach along with dynamic programming driven by the design guidelines. They defined with their co-designers, as well as auditory perception thresholds and prior work on sonification parameters.
A pre-recorded presentation video for the CHI 2022 is available:
Evaluation
To assess the effectiveness of this approach, Siu and co-authors conducted an overall evaluation of audio data narratives. Sixteen screen reader users participated in the study. Participants accessed an audio representation of a dataset in one of two different ways. At first, the narrative condition wherein descriptions and sonification were interleaved into various segments. In the control condition, there were no segments. The entire sonification followed the full description. Both conditions had the same duration and content. The only difference was how the information was presented. As a second factor, authors experimented with varying levels of complexity in the datasets.
Participants provided a description and takeaways from the presentation that they listened to. To understand what participants learned, they coded participants' insights based on different data facts. Additionally, Siu et al. categorized an insight as exact or inferred. An exact inside was information that was repeated from the description, and an inferred insight was information that was not explicitly spoken. Plotting the proportion of inferred insights for each condition and complexity level, the author found that the narrative condition had a significantly higher proportion of inferred insights compared to the control without segments [Figure 2]. In addition, they found that there was an interaction with dataset complexity. In the control condition, users provided more insights when the dataset was simple, but not so much when it was complex, 29% versus 13% respectively. Participants could make more inferences from the sonification when the dataset was simple.
On the other hand, in the narrative condition, they saw no significant difference in insights between the complex and simple datasets. Both are high at 30 and 36%. Taken together, these provide evidence that the narrative helped users better interpret and make use of the sonification to gain insights, especially for complex datasets.
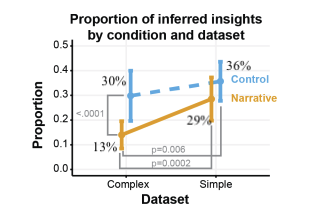
Figure 2: The proportion of Inferred insights by Condition and Complexity
With the narrative condition, participants described their understanding of the data as more detailed and requiring less effort. Participants felt that the descriptions were well complemented by the sonification details. While for the control condition without segment, participants describe their understanding as more general.
Summary and future directions
To summarize, Siu and co-authors investigated the use of description and sonification to improve the understanding of audio graphs. According to the findings, audio narratives allowed independent access to and comprehension of data insights. Participants indicated excitement about having a better knowledge of the data, particularly when contrasted to traditional access methods.
In future work, the author expresses exploring these scopes.
- The author believes there are many opportunities for making the narratives more interactive and adjustable to users' different tasks. Additional queries or segments that they wanted to investigate in more detail.
- There are also opportunities for the narratives to be more engaging, and to provide additional external context, as well as annotations.
- Focused on time series data sets, the author would like to investigate how this can extend to other common types of data charts.
-- Md Javedul Ferdous (@jaf_ferdous)
Acknowledgment
I'd like to acknowledge Dr. Michael Nelson for his invaluable assistance in reviewing my blog article. His expertise and insights greatly improved its quality.
Reference
Siu, Alexa, Gene SH Kim, Sile O'Modhrain, and Sean Follmer. "Supporting accessible data visualization through audio data narratives." In Proceedings of the 2022 CHI Conference on Human Factors in Computing Systems, pp. 1-19. 2022. DOI:10.1145/3491102.3517678
Comments
Post a Comment