2023-01-15: A Summary of "Methodology for heuristic evaluation of the accessibility of statistical charts for people with low vision and color vision deficiency"
The Web Content Accessibility Guidelines serve as the industry standard for digital accessibility, and they have even been recognized as an ISO standard. Many nations have embraced these guidelines as the minimum degree of compliance for public (and in some circumstances, even private) websites. Perceivable, operable, intelligible, and resilient are the four theoretical pillars that form the foundation of WCAG, which organizes itself around every facet of accessibility. Each principle is described in various specific guidelines, which are then converted into immediately evaluable criteria under three levels of conformity. An extensive absence of articles and guidelines focused on the accessibility of statistical charts for patients with LV and CVD was revealed by a prior literature review. This gap has been found, and it exacerbates the marginalization of a user group that represents 97% of persons with visual difficulties.
To fill this gap, a formal and systematic methodology proposed by Quiñones et al. is adopted as the framework of reference in this study, and it is corroborated with the metrics proposed by Jiménez et al. in order to validate the effectiveness of the suggested indicators in comparison to an already-in-use heuristic list control. Eight stages make up this approach. Each one is listed below with a full description of the outcomes:
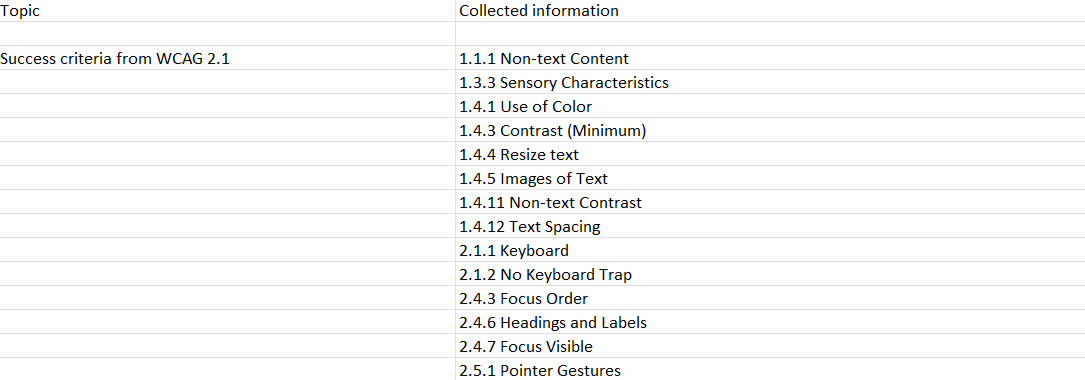
1) Exploratory stage: This stage aims to conduct a literature review with the intention of gathering data for the heuristic list through a review of WCAG 2.1 and associated materials and an attempt to compile all criteria pertinent to the topic of this work (results are shown in the table below).
 |
| Data Collected from WCAG 2.1 (Source: https://doi.org/10.1007/s10209-021-00816-0) |
 |
| Data collected from research conducted on the accessibility of statistical charts (Source: https://doi.org/10.1007/s10209-021-00816-0) |
2) Experimental stage: This stage's goal is to study the data from earlier tests in order to find new information that was missed in stage one. However, the authors were unable to locate any prior studies that concentrated on chart accessibility for users with LV; hence, this step was temporarily skipped.
3) Descriptive stage: This stage concentrates on choosing and ranking the most crucial inquiries from the data gathered in stages 1 (exploratory stage) and 2 (experimental stage). The previous figures show all the relevant information that had been collected.
4) Correlational stage: A number of publications have already suggested tying accessibility and usability standards together, mostly by relating WCAG and Nielsen's heuristics and coming to the conclusion that there is a definite association between the two. In this stage, researchers attempt to harmonize user experience concepts, associated user experience qualities, and existing heuristic indicators with domain features and functionalities. The next step is to categorize the resultant heuristics into five groups: excellent practices, textual alternatives, color and contrast, readability, and additional features and functionalities.
5) Selection stage: In this stage, the goal was to analyze the list of indications that had been developed up to this point and determine whether to maintain, modify, or remove them. According to its potential to address accessibility issues with statistics charts and to meet the demands of the various user profiles, an indicator's "Applicability" column was created, which indicates how significant it is within the context of this research. The three categories of importance are useful, important, and critical, in that order.
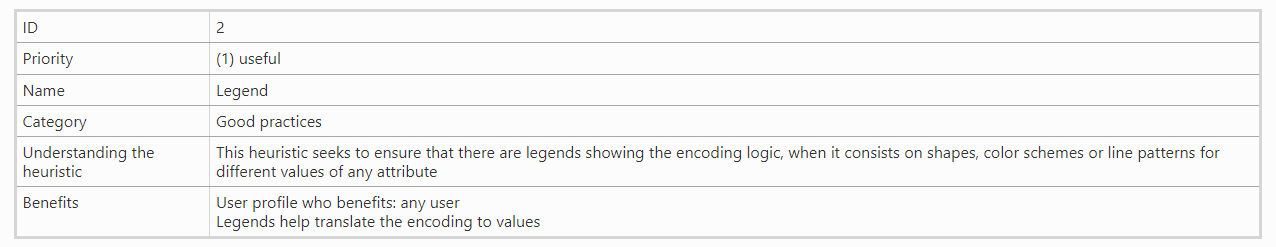
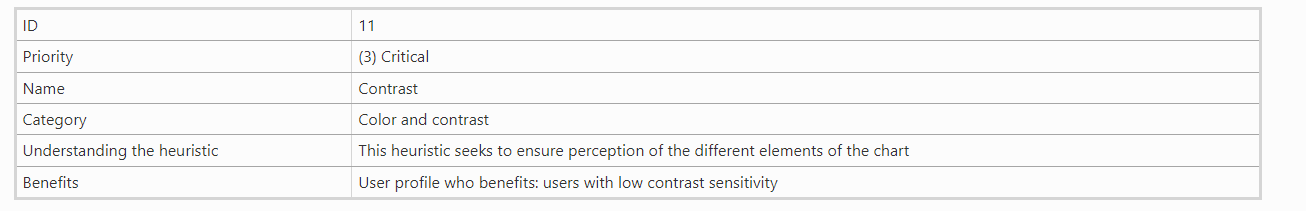
6) Specification stage: In this stage, the results of the earlier stage's indicators were clearly specified. Following this, a set of 17 heuristics were defined, as shown sequentially below with their respective ID numbers. The heuristics were also scored on a 7-point Likert scale and weighted into three categories based on their severity or influence: low impact (level 1), average impact (level 2), and strong impact (level 3). Additionally, it is important to know that a less detailed scale may enable quicker responses and more distinct categories, but it may also lead to bias on the part of the evaluators when their choice is not included. A very granular Likert scale, on the other hand, is more likely to include extensive and inclusive categories, allowing for the collection of more accurate data and more significant statistical results, with higher reliability and validity, and less neutral and "uncertain" responses.
 |
| Heuristic 1. (Source: https://doi.org/10.1007/s10209-021-00816-0) |
 |
| Heuristic 2. (Source: https://doi.org/10.1007/s10209-021-00816-0) |
 |
| Heuristic 3. (Source: https://doi.org/10.1007/s10209-021-00816-0) |
 |
| Heuristic 4. (Source: https://doi.org/10.1007/s10209-021-00816-0) |
 |
| Heuristic 5. (Source: https://doi.org/10.1007/s10209-021-00816-0) |
 |
| Heuristic 6. (Source: https://doi.org/10.1007/s10209-021-00816-0) |
 |
| Heuristic 7. (Source: https://doi.org/10.1007/s10209-021-00816-0) |
 |
| Heuristic 8. (Source: https://doi.org/10.1007/s10209-021-00816-0) |
 |
| Heuristic 9. (Source: https://doi.org/10.1007/s10209-021-00816-0) |
 |
| Heuristic 10. (Source: https://doi.org/10.1007/s10209-021-00816-0) |
 |
| Heuristic 11. (Source: https://doi.org/10.1007/s10209-021-00816-0) |
 |
| Heuristic 12. (Source: https://doi.org/10.1007/s10209-021-00816-0) |
 |
| Heuristic 13. (Source: https://doi.org/10.1007/s10209-021-00816-0) |
 |
| Heuristic 14. (Source: https://doi.org/10.1007/s10209-021-00816-0) |
 |
| Heuristic 15. (Source: https://doi.org/10.1007/s10209-021-00816-0) |
 |
| Heuristic 16. (Source: https://doi.org/10.1007/s10209-021-00816-0) |
 |
| Heuristic 17. (Source: https://doi.org/10.1007/s10209-021-00816-0) |
 |
| Heuristic 18. (Source: https://doi.org/10.1007/s10209-021-00816-0) |
 |
| (Source: http://hdl.handle.net/2445/182301) |
Comments
Post a Comment