2022-03-06: Trip report: The AAAI-22 Workshop on Scientific Document Understanding (SDU@AAAI)

In this blog post, I focus on briefing four papers presented in the SDU workshop held on March 1, 2022, including my paper. Most papers mentioned in this blog post are highly relevant to my research in the field of mining scholarly big data.
1. Segmenting Technical Drawing Figures in US Patents (Hoque et al., ODU & LANL)
This is our paper. The goal is to segment compound figures that include multiple subfigures. The paper compared state-of-the-art unsupervised and supervised image segmentation and object detection methods and found that the transformer-based method called MedT (Valanarasu et al. 2021) achieved the best performance to segment compound figures in patent documents. We compiled an in-house dataset consisting of 500 manually annotated figures from US design patents by drawing bounding boxes. The following segmentation methods were compared,
- Point-shotting: This is a method we proposed in this paper. It works by shooting open dots to a patent figure. Only dots that includes black pixels are retained. This will result in segmented masks. We can then draw contours and rectangular bounding boxes around them and finally get individual figures segmented. The process is illustrated in the following figure.
- U-Net (Ronneberger et al. 2015): U-Net is a type of CNN. It is called U-Net because the encoder (aka contracting network) and decoder (aka expansive path) were arranged as asymmetric "U" shape so that information from an encoder layer was passed to the decoder layer on the same level. The main idea is to supplement a usual contracting network by successive layers, where pooling operations are replaced by upsampling operators. Hence these layers increase the output resolution. U-Net was initially used for segmenting medical images.
- HR-Net (Wang et al. 2020): HR-Net is a type of CNN initially proposed for semantic segmentation, object detection, and image classification. In the NR-Net architecture, new CNN networks branch out from existing CNN networks, to maintain high-resolution representations.
- MedT (Valanarasu et al. 2021): the architecture of MedT has two branches: a global branch, which captures the global visual features, and a local branch, which captures the local visual features. MedT was proposed to segment medical images.
- DETR (Carion et al. 2020): DETR uses a conventional CNN backbone to learn a 2D representation of an input image. The model flattens it and supplements it with a positional encoding before passing it into a transformer encoder. A feedforward network is used for predicting either a detection or a "no object" class. DETR was initially proposed for object detection from natural images.

Except for the point-shooting method, all the other methods are deep learning and require training data. We manually draw bounding boxes of 500 design patent figures. However, the deep learning model requires masks (i.e., object outlines) for training, which are not directly available in the annotation. Therefore, we first use the point-shotting method to generate masks and use them as training data. Furthermore, we retrained U-Net and HR-Net and fine-tuned MedT and DETR. A comparison of models is shown below:
| Model | Training Data | Training Method | F1 | Runtime (sec) |
|---|---|---|---|---|
| Point-shooting | NA | NA | 92.5% | 1035 |
| MedT | Mask | Fine-tune | 97% | 29 |
| HR-Net | Mask | Scratch | 96.5% | 18 |
| U-Net | Mask | Scratch | 91.5% | 15 |
| DETR | Mask | Fine-tune | 91.0% | 1396 |
The results indicate that MedT achieves the best performance with F1=97% and is also a relatively fast method. The datasets and codes are publicly available at https://github.com/GoFigure-LANL/figure-segmentation.
2. Scientific Chart Summarization: Datasets and Improved Text Modeling (Tan et al., UNC Chapel Hill & Bloomberg)
The paper proposed a model for chart summarization, in which a piece of descriptive text is generated given a figure in a scientific paper. The task is illustrated below.
 |
| An illustration of the Chart Summarization task. |
The dataset was created by extracting chart-caption pairs from PubMed Central and arXiv papers. For PubMed papers, the caption is parsed from XML files. For arXiv papers, the caption is parsed from LaTeX files. For each figure, the authors compiled its image, a binary flag indicating whether it is a chart, its type, and its caption using crowdsourcing. Five chart types were considered including Line, Bar, Scatter, Pie, and Area. The data included single figures only (no compound figures).
The main contribution of this paper is an enhancement of an existing image captioning model with an OCR encoder and a pre-trained language decoder. The architecture is shown below:

The architecture of the proposed model
The authors used Tesseract to extract text and their positions on the image and ResNet-101 to encode the figure image. GPT-2 was used as the pre-trained language decoder. The results are evaluated using traditional evaluation metrics including BLEU, ROUGE-L, METEOR, and CIDEr.

The results indicate that there is not a significant improvement by adding the OCR encoder and GPT-2. The authors further investigated whether adding more training samples can help. They used a semi-supervised learning method by adding about 13k single-chart images. The results are shown below.
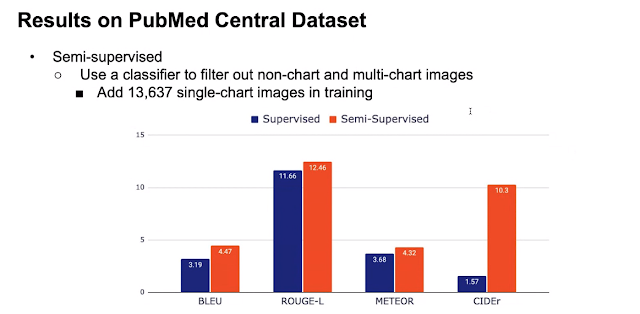
The results indicate that adding more "unlabeled" training samples improved the performance, especially CIDEr.
My comments:
- CIDEr used TF-IDF to aggregate statistics for n-grams. ROUGE-L only considers n-grams. METEOR was based on explicit word-to-word matching, and BLEU is based on the geometric mean of n-gram counts. Therefore, the results indicate that the most prominent improvement was on significant n-grams (CIDEr). The overall n-gram overlap does not show a prominent improvement. More details on evaluation metrics can be found in the Princeton CS lecture slides.
- The nature of the samples used for "semisupervised learning" is not clear to me. The authors used crowdsourcing to label each figure as "whether it is a single chart" and identify its figure type. However, for this task, the "labels" should be captions of figures. So I am not quite clear of whether what the author did should be called semisupervised learning.
- Although the topic is very interesting, the paper did not show a single example of generated captions. It is unclear how well the readability and coherence of the automatically generated captions are. More sophisticated models and evaluation metrics are needed.
3. TableParser: Automatic Table Parsing with Weak Supervision from Spreadsheets (Rao et al., ETH Zurich)
The paper proposed a system to parse modern and historical table structures using a weakly supervised learning. The system was built on DocParser (Rausch et al. 2021 AAAI), a Mask R-CNN-based document parser. The authors attempted to adopt DocParser into a new domain and use it to parse tables.
For completeness, the authors reviewed DocParser. The high-level architecture is shown below.
 System overview of DocParser
The weak supervision means the authors use the annotated generated by Latex directives as labels of the PDF document. The structure was then parsed by identifying entities (i.e., layout components) and their relations.
Table parsing can be performed in a similar manner, in which Latex files are replaced by MS Excel files. The authors used three datasets:
- ZHYearbooks-Excel: containing ~16k modern tables used for weak supervision
- ZHYearbooks-OCR: containing historical tables, only used for testing
- EUYearbooks-OCR: containing historical tables, 17 tables used for fine-tuning, and 10 used for testing
For the testing corpus, the authors used an in-house table annotator to generate the ground truth. The IoU threshold is set to 0.5. The evaluation results indicate that TableParser achieved an average precision (AP) of 83% and 73% for modern tables rows and columns respectively.
My comments:
- Weak supervision is a good idea to obtain a large amount of high-quality training data.
- The IoU threshold seems lower than what I observed in other table parser evaluations. Usually, the threshold is 0.9 or higher. A low threshold will artificially improve the AP.
- The authors did not report any results on standard benchmark data, e.g., ICDAR 2013, ICDAR 2019.
4. When to Use Which Neural Network? Finding the Right Neural Network Architecture for a Research Problem (Färber & Weber, KIT)
The goal of this paper is to build a recommender system so that given a research problem description, the system can recommend proper neural network architectures that should be used. The data of the system includes 66 neural network architectures in Wikidata and about 300k textual problem descriptions. The remaining task is to train a classifier capable of predicting neural network architectures based on textual problem descriptions.

One key issue is to obtain a relatively accurate textual description of a problem. The authors used two methods to obtain the data.
- Abstract splitting (AS). This method assumes an abstract includes a problem description part and a solution part. The authors identified abstracts containing the phrase "in this paper" and "this paper" and split the abstracts into two parts. An example is shown below.
- Keyword-based template method (KE). The authors first find sentences containing a set of neural network names (above) and then manually extracted 44 templates based on regular expressions. The template contains a text span of method and a text span of problem. They then used the templates to find more sentences containing other methods and problems. One example is shown below. The last step is to reduce noise by filtering out common phrases that carry no information (e.g., solved this problem).


After some filtering, the neural architecture counts in the final dataset are shown below.

The authors frame the recommender system as a supervised classification problem and compared 3 approaches:
- TF-IDF + SVM: the input text is represented by a sparse TF-IDF vector, which is further classified by SVM.
- SciBERT + Classification Layer: the input text is represented by a dense vector, and then classified by a fully connected neural network.
- MFC (most frequent class): a baseline
To further test the robustness, the authors also used the Abstract GENeration data set (AGENDA; Koncel-Kedziorski et al. (2019)) as a testing corpus. The AGENDA dataset is a knowledge graph containing paper metadata, abstracts, and labeled tasks and methods. The evaluation metrics are precision, recall, and F1. The results indicate that the SVM classifier trained and tested on KE or trained and tested on AS consistently achieved the best F1 around 0.45. However, the AGENDA data is too challenging, only achieving an F1=0.1, either trained by KE or AS. The data and codes are available at https://github.com/michaelfaerber/NNARec.
My comments:
- The problem to recommend methods by querying research problems is very interesting and worth investigating. I wrote an NSF proposal related to this topic but got rejected because of "lack of novelty".
- Representing research problems is the key issue in this project because the forms of research problems are very versatile. Research problems can be expressed by short or long text. In addition, the lack of training data is a big hurdle. Dr. Färber used a bootstrapped method and generated a large amount of problem-method pairs. Although the method is not very fashionable and the data may not be comprehensive, the preliminary work will be very useful for training more robust and accurate models.
- It would be interesting to compare supervised vs. unsupervised methods (i.e., ranking-based) for this task.
Additional Notable Papers and Final Remarks on the Venue
There are 20 papers presented in this workshop and I do not have the space to summarize all of them. The workshop website lists the full-text of all accepted papers. The titles of several notable titles are listed below.
- RERRFACT: Reduced Evidence Retrieval Representations for Scientific ClaimVerification (Rana et al., University of Mannheim, Germany; Thapar Institute of Engineering & Technology, India; Charles University, Czech Republic)
- Extraction of Competing Models using Distant Supervision and Graph Ranking (Daw & Pudi, IIIT India)
- BAM:Benchmarking Argument Mining on Scientific Documents (Ruosch et al., University of Zurich)
- Acronym Extraction with Hybrid Strategies (Li et al., Tsinghua University, China)
- CABACE: Injecting Character Sequence Information and Domain Knowledge forEnhanced Acronym and Long-Form Extraction (Kannen et al. IIT, India)
The workshop was organized on gather.town, a browser-based virtual environment resembling real meetings. The workshop had a very tight schedule and there was virtually no time to ask questions. All questions had to be handled by the chatting window, which was not very efficient and interactive. In addition, it seemed that when I was "sitting" on my seat, even turning on the microphone on my laptop did not work. The session chair told me to "stand" next to the microphone beside the "stage" so people could hear me. I never tried it.
-- Jian Wu
Comments
Post a Comment