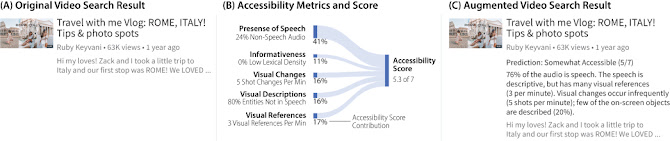
Figure 1: Video (A) contains no information about accessibility. Video accessibility metrics (B), BVI people using it C) to filter or quickly identify accessible videos from search results. (Source: ACM)
Text-based documents, articles, reviews, and reports were the main information sources on the internet. In late 2000, the Internet became mainstream. Among the attractions of this mainstream, Youtube was a popular search platform for watching videos, reaching 81% of internet users. These videos give so much information such as a tutorial, lecture, unboxing video, review, and more that people increasingly use videos instead of text to communicate information. In fact, based on a report provided by YouTube, there are 1 billion hours of videos being played each day on YouTube alone. These videos provide information, both auditory and visually, but the visual content in videos is not accessible to blind and visually impaired (BVI) audience members. Traditionally, to make videos accessible, professionals create audio descriptions that describe the visual content in a video.
In the paper “What Makes Videos Accessible to Blind and Visually Impaired People?”, Xingyu Liu et al., introduces seven new metrics to evaluate the accessibility of video. Among these seven metrics, two of them are audio-related, two of them are video-related, and the rest are audio-visuals metrics (Figure 1B). Lastly, the author did a formative study with BVI people and augmented video search interface for those metrics and predictions (Figure 1C).
Video accessibility metrics
To get a qualitative understanding of the insights of BVI people having an issue while watching a video, the author conducted an interview with 12 BVI people who were regularly using YouTube for a wide variety of tasks, including keeping up with the current events, learning how to dance, and even repairing appliances. All participants mentioned that they searched for videos that were already inherently accessible, or understandable from the audio alone without the additional description of the visual content.
A Pre-recorded Presentations video for the CHI 2021 is available here: A more accessible video, for example, would narrate each instruction of a chocolate chip cookie recipe. A less accessible video may merely play background music or show the steps graphically. Interview participants reported that they evaluated videos to be accessible or inaccessible based on properties of the original video, including audio features such as speech and informative language, and visual features such as infrequent visual changes and simple visual content, and also audio-visual features such as the description of objects, description of on-screen text and few visual references (Figure 2).
Figure 2: The scale of accessibility based on audio, video, or both presence in video content.
However, finding accessible videos with these properties can be tiresome and time-consuming. Participants indicated that they had to use trial and error by clicking on a video, watching a segment of that movie, and then returning to the search page if the video was inaccessible – then repeating the process if the video was inaccessible, they found an accessible choice. The author proposes seven metrics and accompanying algorithms to automatically assess video accessibility to assist people in readily identifying accessible videos (Figure 3). Then, the authors augment a search interface with accessibility metrics to let people filter out inaccessible content.
Figure 3: Proposed accessibility metrics
Evaluation of ratings and video interface
In their work, the authors discover two research questions. To begin, can their seven video accessibility parameters reflect video accessibility as viewed by BVI users? Second, would adding video accessibility metrics to a search interface improve video search for BVI users? They collected accessibility ratings from BVI people for 60 videos to evaluate if our seven indicators indicated accessibility. A regression study revealed a statistically significant association between videos, accessibility, and the measures we presented. The percentage of speech alone contributed more than 40% of the accessibility rating (Figure 4).
Figure 4: Regression models of how 7 accessibility metrics contribute to BVI users’ perceived accessibility scores
They also constructed a video search interface that was enhanced with their video accessibility prediction and metrics, which they tested on eight BVI individuals. When looking for videos, participants overwhelmingly favored the metrics and filter interface; they tried 54% fewer videos and spent 40% less time finding a pleasing video when compared to using the original YouTube interface. Participants were very excited to use this tool, and authors are now actively working on implementing it.
Summary and future directions
In the future, Xingyu Liu et al. intend to use their metrics to provide video and audio description owners with feedback on which parts of the video require additional description. In addition, BVI users rated video accessibility subjectively in their study. And there could be information missing that they aren't aware of. They're looking into the differences between the perceived and objective accessibility of videos. Finally, the author was deploying the tool as a browser extension for YouTube to determine the long-term impact of this tool.


Comments
Post a Comment