2021-01-26: Summary of "CVExplorer: Multidimensional Visualization for Common Vulnerabilities and Exposures"
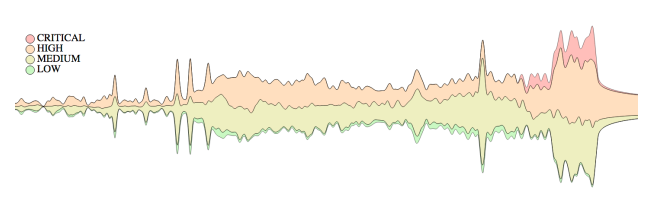 |
| Figure 1: Overview of 110,766 CVEs reported from 1998 to 2018 obtained from the NVD. Layers are severity classification: low, medium, high, and critical. (Source: Pham et al.) |
Computing network facilities and data storages in national, industry, academic research labs, and offices are all possible targets of cyber attacks. A network vulnerability analysis, remediation, and alerting tool that can help enhance the security against cyber attacks caused by human error can potentially reduce network vulnerabilities. Even though human error is the most significant cybersecurity vulnerability (e.g., falling for phishing, unrestrained web browsing, and weak passwords), most commercial vulnerability scanners are not designed to detect vulnerabilities introduced by humans interacting with the system.
In their paper, CVExplorer: Multidimensional Visualization for Common Vulnerabilities and Exposures, Pham et al. introduce a novel interactive system for visualizing cybersecurity threats reported in the National Vulnerability Database (NVD), a widely used database containing thousands of records about specific device vulnerabilities. The proposed system aims to work as a reporting and alerting tool that can help enhance the security against cyber attacks and potentially reduce network vulnerabilities. In particular, the authors expand the features exposed by vulnerability scanners such as Nessus and Shodan and present vulnerability assessments to users via interactive visual interfaces, Figure 1, instead of dealing with tediously technical outputs. Pham et al. note the following contributions provided by their research:
- They propose a new approach to analyze prominent features in Common Vulnerabilities and Exposures (CVE) entries through coordinated multiple views. In contrast to existing techniques which mostly examine one dimension at a time, Pham et al. inspect the relationships of these dimensions for interesting correlations.
- They developed an interactive prototype, named CVExplorer, which uses customized visual representations to explore relationships in big data. The CVExplorer supports a range of interactive features allowing users to isolate events of interest quickly.
- They demonstrated the CVExplorer on two case studies of Common Vulnerabilities and Exposures reported in 2017 and of an Autonomous System Number (ASN).
Related Work
Pham et al. surveyed cybersecurity visualization techniques to highlight the most related work. Current approaches to vulnerability assessments can be roughly classified into passive and active vulnerability assessments. Passive vulnerability assessment techniques aim to cross-reference system specific characteristics with databases of known vulnerabilities, such as the NVD. In contrast, active vulnerability assessment techniques actively probe devices to identify vulnerabilities, including port scanning, checking for SQL injections and HTML injections, monitoring network traffic, and dropping malicious or exploitative payloads. While passive vulnerability assessment supports historical vulnerability assessments on vulnerabilities throughout a services' lifetime, active vulnerability assessment only provides a snapshot in time of known vulnerabilities.
The authors note other visualization methods using free and open-source tools. These alternative methods are limited to capture large data in a simplified, visual representation. Scalability is another issue with a one-to-one mapping between devices and nodes for large networks with thousands of devices. Further, Pham et al. note that most three dimensional systems are harder for a security analyst to perceive and interact with (compared to conventional 2D systems) due to occlusions which require a substantial amount of interactions (such as rotating and zooming) from a security analyst. Consequently, the authors' proposed system focuses on 2D standard and modified visualization techniques to tackle the design requirements for analyzing a large number of CVE entries.
Design Motivations and Decisions
Pham et al. start with some background knowledge on the Common Vulnerability Scoring System (CVSS) defined by the NVD. The authors focus on the latest CVSS v3.0 and use the color-encodings in Figure 2 for their visualizations.
 |
| Figure 2: NVD Vulnerability Security Ratings. (Source: Pham et al.) |
Vulnerability Metrics
CVSS is a free and open industry standard for assessing the severity of computer system security vulnerabilities. CVSS assigns severity scores to vulnerabilities, allowing responders to prioritize responses and resources according to the threat. NVD provides CVSS scores for almost all known vulnerabilities. The NVD supports both CVSS v2.0 and v3.0 standards which contain base scores (which represent the innate characteristics of each vulnerability), temporal scores (metrics that change over time due to events external to the vulnerability), and environmental scores (scores customized to reflect the impact of the vulnerability on an organization).
The CVE is a catalog of known security threats sponsored by the United States Department of Homeland Security (DHS). Threats are divided into two categories: vulnerabilities and exposures. The CVE entries available in the NVD include a variety of fields such as the vulnerability scores, the type of software weaknesses, vulnerable vendors (e.g., Microsoft, Oracle) and products (e.g., Windows, Adobe), external references to advisories, CVE published date, CVE last modified date, and entry descriptions. These are the important variables for the CVExplorer tool.
Design Motivations
To free a cyber analyst from tediously long vulnerability outputs, CVExplorer inspects the dynamic correlations between dimensions to answer the following research questions:
- R1: Are there any relations within and between vendors, products, and vulnerability types at a given time point/interval?
- R2: For a given vendor, what are the targeted products/software and what are their level of vulnerability change over time?
- R3: What are the popular vulnerability types and how did they evolve?
- R4: What are the popular topics associated with the different levels of vulnerability severity over time?
Design Decisions
Parallel coordinates are a standard way of visualizing high-dimensional geometry and analyzing multivariate data. Therefore parallel coordinates are adapted by CVExplorer to display the correlations of prominent dimensions within the CVE data. Pham et al. use force-directed layouts as the primary way to group related entities (vendors, products, and vulnerability types) and minimize link crossings which are the main limitation of parallel coordinates. While very effective for visualizing network structures, the lack of temporal information is the main drawback of the force-directed graph. Therefore, the authors propose a hybrid visualization of Streamgraph and Wordle to maximize the space usage for displaying the evolution of important topics (vendors, products, and vulnerability types) and communicating criticality trends.
CVExplorer Visualizations
Figure 3 is an example of the analysis provided by CVExplorer. Figure 3(a) uses parallel coordinates to present the relationships between prominent dimensions in the CVE data. The last dimensions are ordered by how popular they are in the input data. The right panel in Figure 3(b) also supports group or individual CVE selection. The Timed Wordle depicted in Figure 3(c) is implemented using the combined Wordle and Streamgraph algorithms. Wordle's main strength is the ability to give quick emphasis on important terms using relatively larger font sizes. The force-directed layout depicted in Figure 3(d) shows the relationship between entries (vendors, products, and problem types) if they appear in the same CVE and are connected by a link. The link thickness indicates how often specific entries are reported in the same CVEs.
 |
| Figure 3: CVExplorer visualization for 653 CVEs. (Source: Pham et al.) |
Use Cases
The use cases demonstrate how Pham et al. approach two sample CVE subsets to show how CVExplorer could quickly highlight security problems with different qualitative severity rankings over time and also assists in an in-depth investigation, if needed. The first use case, Figure 4, analyzes security alerts reported in 2017 from the NVD data feeds.
 |
| Figure 4: CVExplorer visualization for the NVD CVE-2017 dataset for high and critical qualitative severity rankings: (a) CWE-284, CWE-119, and CWE-89 as the dominant security problem types in 2017; (b) tcpdump and CWE-119 are the dominant vendor and problem type in September 2017 and Oracle has seasonal reporting schedule; (c) The network view shows the relationships among the main problem types and vendors. (Source: Pham et al.) |
The second use case, Figure 5, is the analysis of the security issues of an ASN with CVE dataset collected from Shodan. The first use case communicates global criticality trends, while the second use case demonstrates CVExplorer's application to a specific security event.
 |
| Figure 5: Visualizing features of CVEs from an ASN: (a) Parallel coordinates of prominent dimensions, (b) Timed Wordle highlights the recent critical problem type, vendor, and product (at the right arrows) versus those in 2010, (c) Network view confirms the stronger connections among problem types, vendors, and products in (b) via thicker links. (Source: Pham et al.) |
Summary
This paper proposes an interactive visual analytics system for analyzing vulnerability reports from the NVD. The system has three linked components: Parallel coordinates, forced directed network, and Timed Wordle. While parallel coordinates are a standard technique for visualizing high-dimensional data using polylines, the force-directed layouts provide a way to highlight related entities by positioning them close to each other. Network entities are brought closer to each other (forming clusters) by forces applied to nodes and connections between nodes. Finally, the Timed Wordle provides a supplemental view on the evolution of vendors, products, as well as types and levels of vulnerability.
CVExplorer is implemented in D3.js. The online application, source code, supplementary materials, additional use cases, and a demo video are provided via the authors' GitHub project repository, at https://idatavisualizationlab.github.io/CVSS/.
-- Corren McCoy (@correnmccoy)
Pham, V., & Dang, T. (2018, December). CVExplorer: Multidimensional visualization for common vulnerabilities and exposures. In 2018 IEEE International Conference on Big Data (Big Data) (pp. 1296-1301). IEEE. 10.1109/BigData.2018.8622092 [PDF]
Comments
Post a Comment