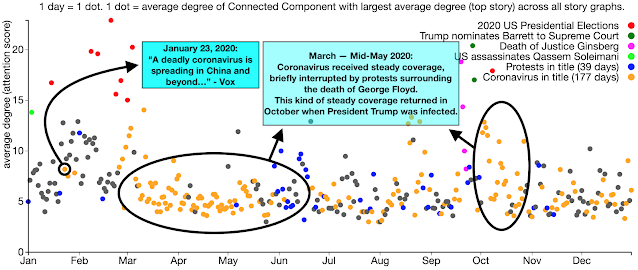
2021-01-20: 366 dots in 2020 - top news stories of 2020
I join the chorus to say 2020 was a year like no other, and shaped by three historic events: the Coronavirus pandemic, the protests surrounding the Black Lives Matter movement, and the US Presidential elections.
According to StoryGraph, in 2018, the top news story was the Kavanaugh hearings. In 2019, it was the Mueller Report. Similar to 2018 and 2019, we analyzed all news stories collected by StoryGraph at 10-minute intervals every day in 2020, to identify the top news stories of 2020. Recall how we identify top news stories, explained briefly in 365 dots in 2019 and in detail by the tech report, and repeated here for convenience.
Summary of StoryGraph's "top story" selection criteria
A "top story" according to StoryGraph is a story with a connected component with a high average degree. Connected components are generated by linking highly similar nodes (news articles) represented by the entities (e.g., people, locations) in the news articles. The news articles were extracted from the RSS feeds of 17 US news sources across the partisanship spectrum (left, center, and right). The code is available and the algorithm is described elsewhere. But essentially, the more various news organizations use the same entities (e.g., people, locations, organizations) in their reporting, the more important the story. A graph is constructed with the nodes represented by entities extracted from news articles, and an edge between a pair of news articles nodes represents a high degree of similarity between the news articles. A connected component represents a news story (e.g., Mueller Report), and the average degree (y-axis in Fig. 1) of the graph's connected components (GCC average degree) is the attention score.
The top news stories of 2020
The top news stories of 2020 according to StoryGraph centered around the 2020 US Presidential election (e.g., Las Vegas Democratic Presidential Debate, Biden's Super Tuesday Wins), the US Supreme Court (e.g., Trump nominates Justice Barrett to the Supreme Court, Death of Justice Ruth Bader Ginsburg), the assassination of Iranian Commander Soleimani by a US airstrike, etc.
| Rank | Date (MM-DD) | News Story | GCC Avg. Deg |
|---|---|---|---|
| 1 | 02-20 | Las Vegas Democratic Presidential Debate | 22.90 |
| 2 | 09-26 | Trump nominates Justice Barrett to the Supreme Court | 20.40 |
| 3 | 09-19 | Death of Justice Ruth Bader Ginsburg | 18.81 |
| 4 | 01-03 | US assassinates Iranian General Qassem Soleimani | 13.81 |
| 5 | 06-20 | William Barr tells Geoffrey Berman that he's been fired | 12.92 |
| 6 | 01-31 | Final phase of impeachment trial of President Trump | |
| 7 | 10-03 | Trump hospitalized after positive coronavirus test | |
| 8 | Justice Department has drops Michael Flynn's case | ||
| 9 | Trump pressures Georgia governor to overturn the election | ||
| 10 | Prosecutors Withdraw From Roger Stone Case |
 |
| Tracking the duration of Coronavirus (orange dots) coverage by focusing on three event cycles. First, early reports from Vox about the virus spreading in China and beyond. Second, steady coverage from March to mid-May 2020, briefly interrupted by protests surrounding the death of George Floyd. Third, the return of steady coverage in October 2020 following the infection of President Trump and other prominent Republicans. |
| Rank | 2018 Sumgrams |
2019 Sumgrams |
2020 Sumgrams |
|---|---|---|---|
| 1 | white house |
white house | joe biden |
| 2 | brett kavanaugh | mueller report | white house |
| 3 | donald trump | impeachment inquiry | supreme court |
| 4 | supreme court | donald trump | covid 19 |
| 5 | michael cohen | trump impeachment | impeachment trial |
| 6 | north korea | democratic debate | donald trump |
| 7 | christine blasey ford | joe biden | amy coney barrett |
| 8 | el paso | bernie sanders | |
| 9 | trump indicted | kamala harris | |
| 10 | nancy pelosi | new hampshire |
The colored text in the table represents ngrams present in 2020 and the previous two years. The table reveals the elevation of joe biden in the national conversation from 2019 (7th place) to 2020 (1st place). In contrast, the frequency of mentions of donald trump steadily declined from 2018 (3rd place) to 2019 (4th place) to 2020 (6th place). The supreme court was prominent in the conversation in 2018 (due to the Kavanaugh hearings), it disappeared from the rankings in 2019, but reappeared in third place in 2020 due to the death of Justice Ginsberg, and the nomination of Judge Amy Coney Barrett to fill her seat.
The top 10 sumgrams of 2020 also featured an unwelcome guest, covid 19 (4th place), one we most certainly hope, takes the exit in 2021.

Comments
Post a Comment